
Without transmission, there will be no green transition. Building a clean power sector is at the heart of wider economic decarbonisation. This vital process hinges on transforming the transmission and distribution networks (hereafter “the grid”)[1] to meet demands for higher capacity, a proliferation of new connections to renewable sources, and the different geospatial requirements of a renewables-based system. The current government target for a decarbonised electricity system is 2035. The Labour Party has pledged an even more ambitious 2030 target. To meet either is no small feat. As an indication of the physical challenge at hand: according to National Grid, to meet the government target, five times the number of transmission lines need to be built by 2030 than were built in the last 30 years.[2]
The massive buildout of clean generating and storage capacity required for either target — and for economy-wide net zero by 2050 — will require unprecedented investment in the grid. Modelling by the Department for Energy Security and Net Zero (formerly BEIS) estimates that the “network costs” (paid to transmission and distribution companies via customer bills) associated with the grid upgrades required for net zero could cumulatively total between £40 billion and £110 billion by 2050.[3] Importantly, beyond the sheer scale of investment, there are also urgent questions about how to coordinate that investment and the associated deployment of new infrastructure at sufficient speed.
In stark contrast to this need, the pace of investment in the grid has stagnated over the past decade and, according to analysis by Carbon Tracker, decreased since 2017 despite a quadrupling in the deployment of new solar and wind.[4] The impacts of structural underinvestment in the grid are already visible: “congestion costs” — incurred when the grid is unable to handle the amount of electricity being produced at a given time — currently reach up to £62 million per day, or £1.94 billion per year.[5] As demand continues to rise, the aging networks exhibit increasing “leakage”, resulting in a loss of roughly 25 terawatt hours in 2022 — equivalent to the total quantity of energy imported to the UK this year.[6] And, renewable projects now face up to 13 years to connect to the grid from the planning stages, with 600 renewable and battery storage projects with a combined capacity of 176GW in the queue to connect in England and Wales alone, compared with just 64GW of connected capacity in these technologies.[7]
This report argues that underinvestment is a feature, rather than a bug, of the regulated private monopoly model of grid ownership and governance, which is unable to deliver the scale of investment and strategic coordination of deployment needed at the pace required. In what follows, we examine the impacts of this model of ownership and argue that it is ill-suited to the operation of this vital infrastructure and incapable of meeting the urgent challenge of building a decarbonised electricity system. We argue that this problem is not incidental but structural — a mechanical outcome of organising the ownership and operation of the grid around a fragmented set of privately owned monopolies whose ultimate mandate is to maximise profit for shareholders.
Owing to its centrality to decarbonisation of electricity in the UK, we focus primarily on the financial accounts of National Grid, the transmission operator for England and Wales. Financial data is also presented for the distribution companies (DNOs), where available. Due to data limitations, the two Scottish transmission operators are excluded from the present analysis. We find that:
With respect to electricity distribution, we find that:
Regulation and other state interventions can alter the incentives for transmission and distribution companies to invest, but only to a limited degree, with control over investment decisions ultimately delegated to private actors whose overriding imperative is to maintain a subjectively suitable level of profitability. Given the urgency and complexity of the task at hand, it is untenable to continue to rely on the fundamentally uncertain investment decisions of for-profit monopolies. Indeed, recent regulatory and governance changes indicate an implicit acknowledgement of the unsuitability of market-led coordination of this task, from the government’s decision to established a new public body in Future System Operator, to Ofgem’s description of its new accelerated investment framework as “part of a departure from traditional incremental network build towards a more co-ordinated, top-down network planning approach.”[12]
However, while recent policy and regulatory changes contain clear acknowledgement — implicit or otherwise — of the inadequacies of the current model, changes made to date lack the necessary powers and coherence to deliver on their stated goals. Importantly, the regulated monopoly model is likely functioning at the limits of its efficacy: stricter regulation of private monopolies in the effort to mandate greater investment, shape where and when that investment is allocated and rein in financial extraction will run into direct conflict with companies’ need to remain appealing to private investors, whose interests are likely to be directly compromised by regulatory action sufficient to deliver the required outcomes. At a moment when both the urgency and magnitude of the need for investment is at its greatest, this is a potentially irreconcilable conflict in an area where compromise is untenable.
While re-nationalisation of these assets entails a one-off cost, given the immense ongoing costs of continued private ownership — from substantial congestion costs as a consequence of inadequate investment, maintenance and planning to structurally higher ongoing operation and investment costs relative to public ownership — public ownership is an investment well worth making. Public ownership of the grid would instead allow for direct investment divorced from the profit imperative, while also maximising the power of the state’s risk-bearing capacity, planning functionality and structurally lower cost of capital to coherently plan and rapidly deliver a renewable-ready grid at lower cost to the public. According to a 2019 report from the University of Greenwich, savings from public ownership of the grid could total over £3.7 billion per year — an annual saving of £174 per household.[13]
Public ownership will need to go hand in hand with changes to planning permissions, including mechanisms to engage and gain consent from communities affected by new grid construction. On these points, the recent Wisner Report from the UK’s Electricity Networks Commissioner makes several recommendations.[14] Policy changes in these areas, while important, are beyond the scope of the present report.
Ultimately, because we all require electricity to participate and thrive in society, the public is already paying, and will inevitably pay, for the transformation of the grid to support a decarbonised electricity system and wider economy. The question is how these costs are distributed and how the required investment is coordinated. Public ownership can address these urgent challenges, offering:
If the government is to achieve its target of decarbonised electricity system by 2035, it cannot leave the transformation of the grid to private investment and coordination. Likewise, if Labour is serious about meeting its 2030 target and agenda of national renewal based on the interlocking ambitions of net zero and “securonomics”, a publicly-owned and strategically coordinated grid is vital.
The UK’s climate ambitions hinge on the decarbonisation of electricity. The rapid transition to clean power will not only curb emissions from current patterns of electricity use, but also enable electrification of downstream production processes and, through cheaper power provision, support the development of a thriving green manufacturing sector and broader macroeconomic stability.
The commitment by the government to deliver a decarbonised electricity system by 2035 entails a radical transformation of the energy system in the UK where gas-fired power stations still provide roughly 40% of annual electricity demand (Figure 1).[15]
[.fig]Figure 1: UK Electricity Production by Source[.fig]
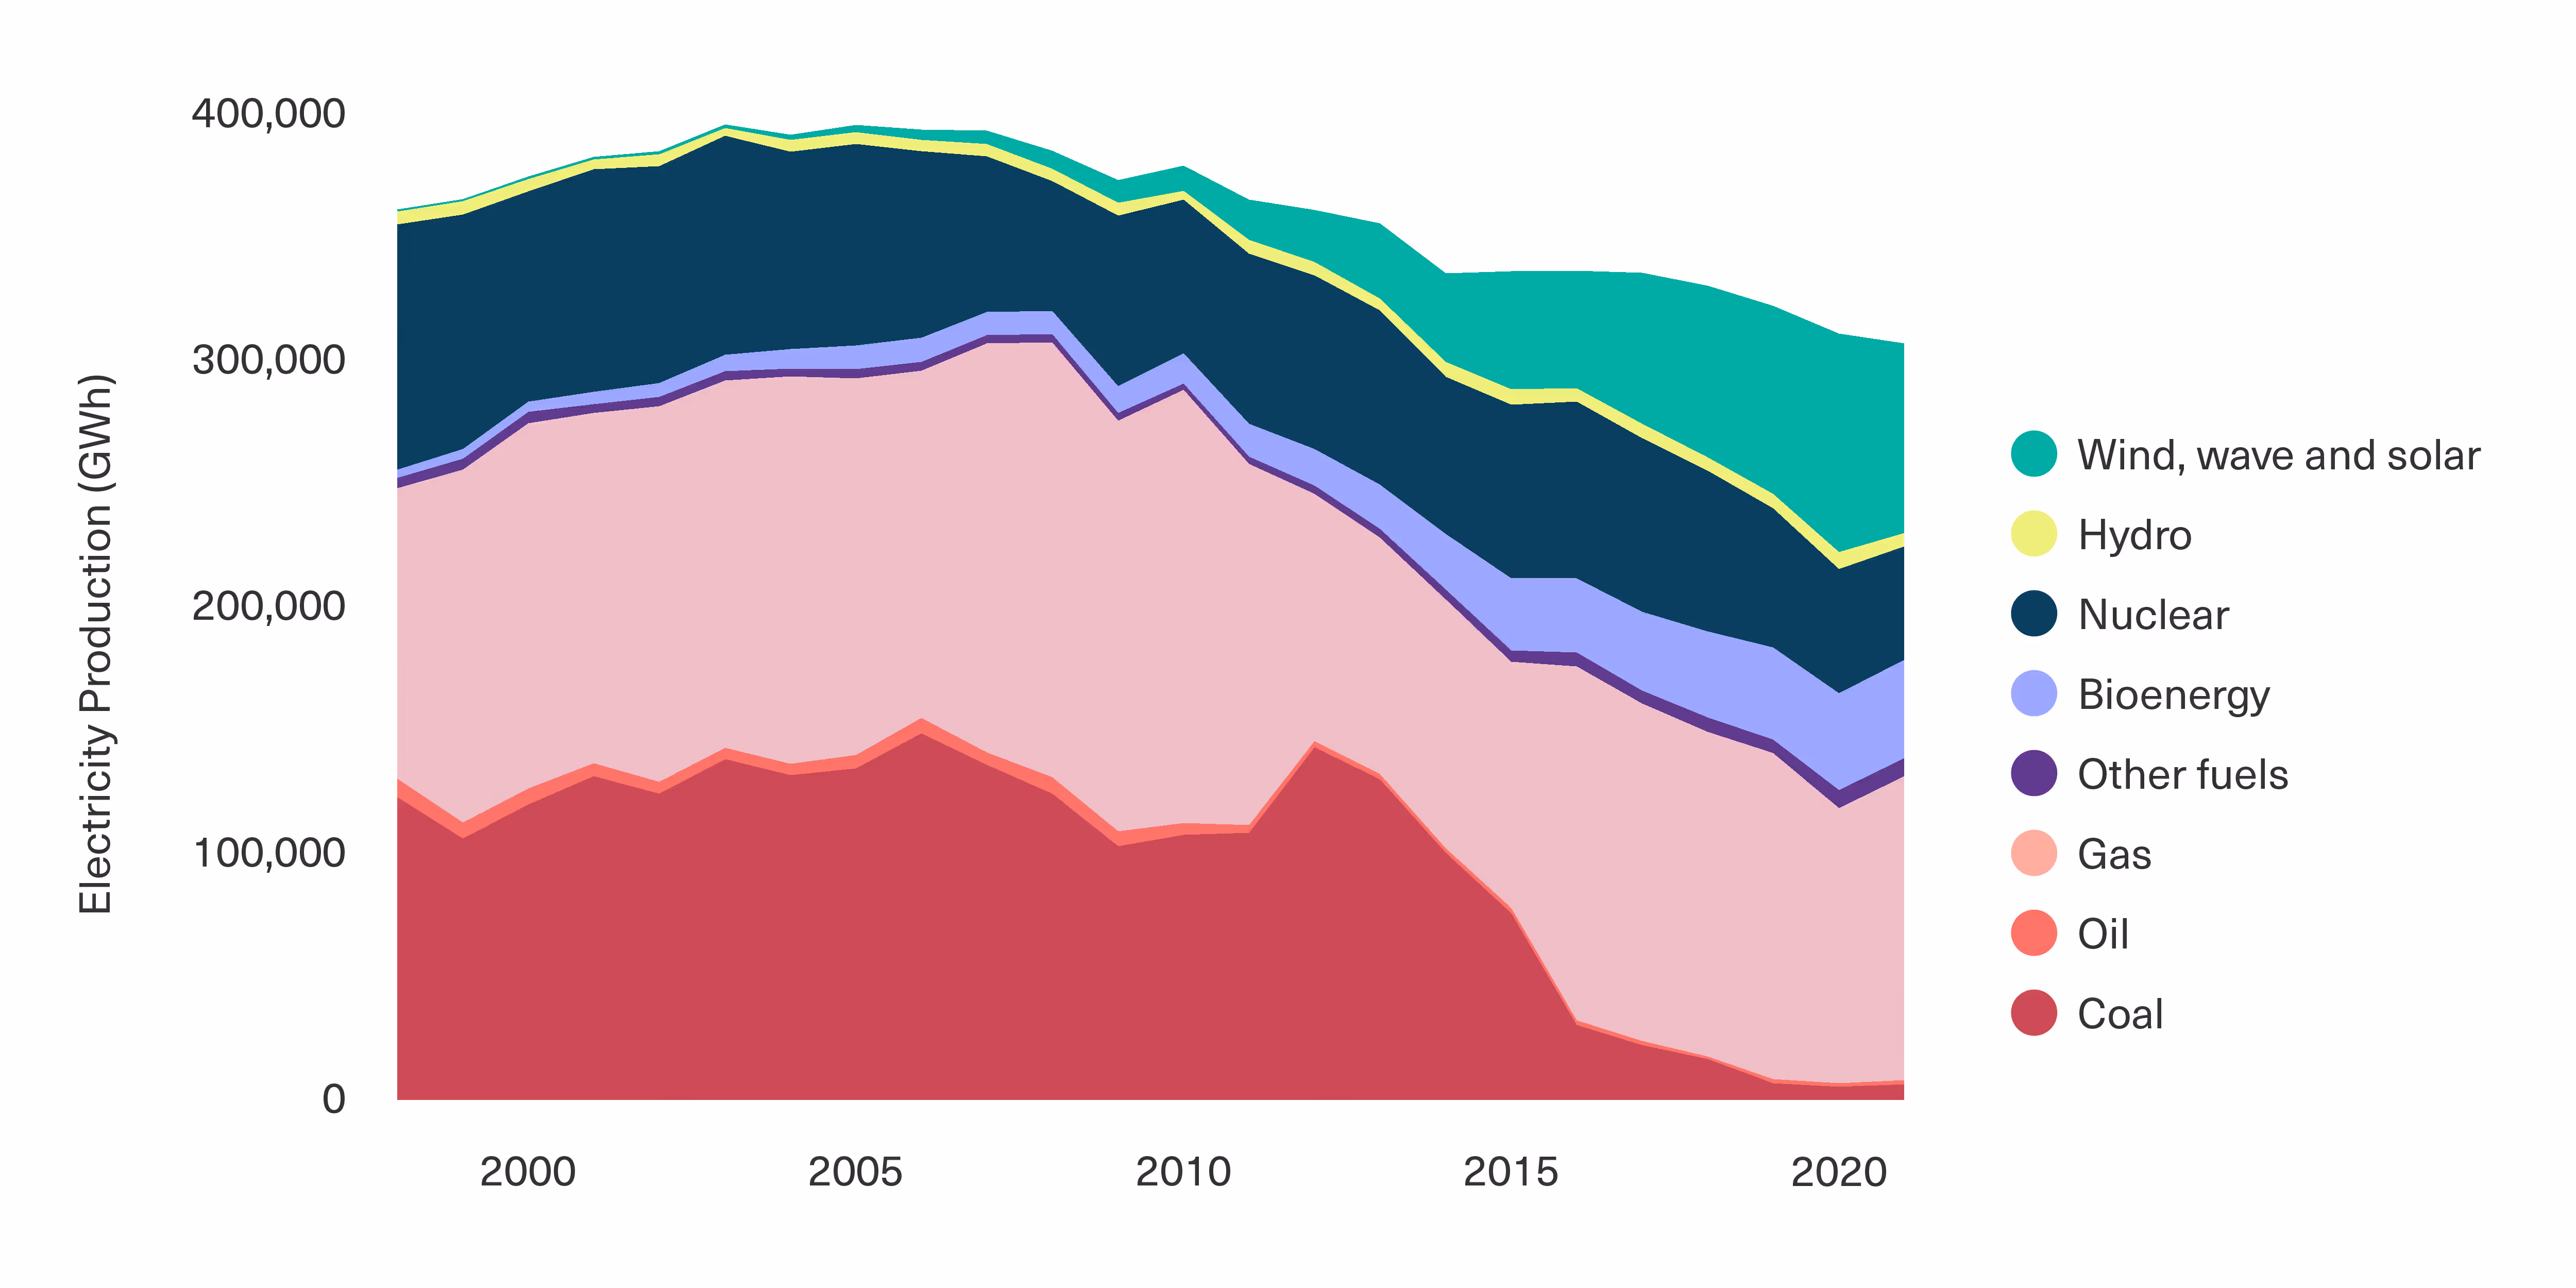
[.notes]Source: BEIS Digest of UK Energy Statistics (DUKES)[.notes]
To meet this target, the government plans to deliver 50GW of offshore wind by 2030 — increasing existing capacity by four times in just seven years — and increasing solar capacity by five times by 2035.[16] Labour’s even more ambitious proposal for 2030 means the party will have to deliver this same transformation within five years of its potential election. While the Labour Party’s associated flagship proposal to establish a publicly owned energy generation firm, Great British Energy, has the potential to accelerate the buildout of renewable generation capacity to meet this target, the proposal risks being undermined by the failure to attend to perhaps the most significant obstacle in the path to a clean electricity system: structural underinvestment in the grid as a consequence of private monopoly ownership.
As an indication of the scale of investment required to overhaul the grid, modelling by the Department for Energy Security and Net Zero (formerly BEIS) estimates that “network costs” — the fees recouped by the transmission and distribution companies as a percentage of energy user bills to pay for these firms’ operations and investment — will cumulatively total £300-£350 billion by 2050. Of this total figure, between £40 billion and £110 billion is specifically attributed to the costs that companies “will be allowed to recover by 2050 to fund the required network investment to reach net zero” — in other words, the cost of investment required to enable economy-wide decarbonisation.[17]
Recent developments suggest the real figure is likely to fall toward the higher end of this range. For instance, under its new Acceleration Strategic Transmission Investment (ASTI) framework, Ofgem has greenlit the acceleration of £20 billion of new grid connection projects between 2023 and 2030 alone to put the system on track for the 2035 target. It has also approved £20.9 billion for distribution network investment under the current price control framework, which for distribution runs until 2028.[18]
The grid — which we use here as shorthand for the transmission and distribution networks that carry electricity from generators to end users — was initially built for the era of fossil fuel power and must be rapidly updated and extended for the era of clean energy with increased connections, capacity and flexibility. These urgent changes are necessitated by both a significant anticipated rise in energy demand, in large part related to the electrification of other sectors from transport to heavy industry, as well as the unique demands placed on electricity networks by the transition to a highly distributed, variable system of generation, i.e. one dominated by renewable generation.
With respect to the accelerating decarbonisation of the grid, Labour has thus far pledged to “remove the barriers to facilitate the largest upgrade to our national transmission infrastructure in a generation”, namely:
Similarly, in the recent Winser Report published by the independent Electricity Networks Commissioner, a number of recommendations were made with respect to accelerating the establishment of the new “Future System Operator” to plan new grid construction, making changes to the planning and consenting processes in Great Britain and creating new guidelines for community benefit with respect to new network construction.[19] While the above reforms are welcome, they do not resolve the challenges related to investment and coordination outlined in the remainder of this report.
As a private monopoly, National Grid is structurally impervious to competitive pressures, and its investment decisions, while regulated by Ofgem, are fundamentally shaped by the mandate to maximise profits for shareholders through rent extraction from the public. Regulation and state intervention that stop short of changing ownership structures can only indirectly attempt to induce investment, which leaves the delivery of investment at the scale, pace, and with the strategic coordination necessary, highly uncertain. As we have seen with privatised utilities across the UK economy from energy to rail and water, the drive to distribute earnings to shareholders encoded in the DNA of the private for-profit utility means structural underinvestment is a constant risk, regardless of a regulator's actions. In the following, we argue that a return of the grid to public ownership is the most effective, cost-efficient and just strategy for rapid decarbonisation of electricity in the UK. Indeed, we contend that it is likely the only model that can deliver the scale and pace of transformation required, while also attending to vital concerns including energy security, universal affordability and distributional justice.
It is telling that in their pledge to “Make Britain a Clean Energy Superpower”, Labour notes without irony that they “are confident the transmission operators can do it, because we did it before: between 1950 and 1975, UK electricity generation and associated grid capacity increased by almost five times”.[20] What they fail to note is that during this period, the entirety of the electricity system was under public ownership and control, with investment and buildout correspondingly organised around a clearly defined and publicly coordinated goal of national development.
In the following, we outline the arguments for public ownership of the grid, with a focus on the transmission network as integral to accelerating decarbonisation of electricity in line with either the government’s 2035 target or Labour’s more ambitious 2030 target. We begin by outlining the central role of the grid and the challenges it faces as the backbone of a decarbonised future economy. We then examine the prevailing regulated monopoly model for organising the operation of and investment in the grid, highlighting the problem of underinvestment and the major costs this is already imposing on the system and on all of us through our bills. Finally, we turn to the urgent case for public ownership of transmission, arguing that it is the only approach capable of delivering the scale and coordination of investment required at the necessary pace, while also cutting costs and supporting the transformation of our electricity system to one that guarantees secure, affordable and clean energy for all.
The grid describes the physical networks that carry electricity from sources of generation to end users like households and businesses. Functionally, it is divided into two main components: the long-range, high voltage transmission grid that spans the country and the regional lower-voltage distribution networks that carry electricity between the main transmission lines and end users or some generators. Grid infrastructure is a natural monopoly: it would be both highly inefficient and impractical to have a “competitive” grid infrastructure in which companies built and operated multiple sets of parallel cables spanning the country and serving precisely the same function. Despite this, along with the other pillars of the energy system — generation and retail supply — the infrastructure and management of transmission and distribution that belonged to the public until 1990 were privatised and divided into a suite of companies, each acting as a private regulated monopoly in a given region, with Ofgem setting pricing and investment rules for the firms.
In England and Wales,[21] a single publicly-listed company, National Grid plc owns and operates the long-range transmission network, while Scotland’s transmission is owned and operated by Scottish Power Transmission Limited for southern Scotland and Scottish Hydro Electric Transmission plc for northern Scotland and the Scottish islands. Collectively these three firms are referred to as the Transmission Operators (TOs). Seven distribution network operators (DNOs) own and operate the low-voltage regional networks that carry electricity from the national transmission grid to end users (e.g. homes and businesses). For a list of the DNOs, see Appendix 1. If the grid were a circulatory system, the TOs could be thought of as arteries, transporting blood over long distances at higher pressure throughout the body, while the DNOs operate like capillaries, delivering smaller volumes to locally distributed destinations.
The decarbonisation of the electricity system and wider economy depends on investment in extending and upgrading the grid. There are several key challenges implied in the decarbonisation of the grid. These include:
The Committee on Climate Change estimates a 50% increase in electricity demand by 2035 and a doubling of demand by 2050 in their “Balanced Pathway” scenario for a decarbonised UK economy.[22] This is because — despite the major efficiencies to be gained from the transition away from fossil fuel technologies — the electrification of several major sectors including transport and heavy industry will generate a significant net increase in demand for electricity.
Our electricity system was designed around a relatively small number of large onshore generating plants — principally coal, followed by gas and nuclear. By contrast, a decarbonised system will be defined by a significantly more distributed system of renewable generation, presenting the challenge of building and extending networks to connect many new generation projects to the grid. Additionally, compared with legacy energy sources, current plans for the development of onshore renewables and nuclear are focused largely in rural areas, meaning a greater share of generation will be situated at further distances from demand centres (cities) and will require the infrastructure to connect it.[23]
Chief among geographical challenges is the complexity and scale of building connections to offshore wind farms, many of which are or will be built in Scotland, while demand is disproportionately concentrated in Southern England. In practical terms, this challenge can thus be thought of as twofold: the urgent need to build new connections over long distances and to offshore sites to keep pace with the buildout of offshore wind generating capacity, and the need to expand transmission capacity to alleviate grid congestion between generating sites and end users. To understand this congestion, it is simplest to imagine transmission cables as pipes, with a limited volume of electricity that can be carried by a certain quantity of cable. As distributed generation and demand both continue to rise, the physical infrastructure of the existing networks — that is, the cables — must be expanded to accommodate a larger flow of electricity over these critical routes.
While there is no question of the feasibility of a fully decarbonised electricity system powered by renewables, there are nonetheless major challenges in building a system dominated by “intermittent” sources — that is, sources whose generation is dependent on external factors like wind and sunlight, rather than sources that can be readily switched on and off at will like a gas-fired plant (assuming secure availability of affordable gas which, as the energy crisis following the Russian invasion of Ukraine has shown, is far from guaranteed).
To ensure a stability of supply and balance between supply and demand, renewable generation must be complemented by a blend of “firm and flexible” low carbon generation such as nuclear, storage capacity, and/or “demand side response”. As per BEIS, “new nuclear projects will likely require significant network investment and infrastructure”.[24] Further, investment is needed to plan, coordinate and deliver small-scale or “distributed” storage, for instance using a potential proliferation of EV charging points as storage to balance supply and demand in a decarbonised grid.[25] At present, ultimate responsibility for investing in and coordinating the deployment of these assets is unclear and fragmented as a result of privatisation.
In addition to owning and operating the physical transmission infrastructure in England and Wales, National Grid also served until recently as the Energy System Operator (ESO), responsible for balancing supply and demand in the energy market across the whole of Great Britain. In April 2022, the government announced its intention to take the ESO into public ownership as the Future System Operator (FSO), to be established as a public corporation operating independently from government.[26] Under this new structure, the FSO is responsible not only for real-time balancing, but also for “taking a whole energy system approach when operating, planning and developing the network”. In practical terms, its mandate is limited to “provid[ing] expert advice, analysis and information to Ofgem and government,” in order to meet the government’s legislated objectives of energy security, net zero and delivering an “efficient, coordinated and economical” energy system.[27] Thus, rather than given the powers to use its insight and analysis to directly coordinate and deliver the investment that it determines is necessary, the current plan for the FSO would limit its powers to merely advising a regulator and government on a strategy who will then interact to incentivise a private monopoly to deliver it. Importantly, National Grid’s ability to deliver investment will remain constrained by its need to attract and retain private investors based on a desirable level of private returns. Thus, the socialisation associated with the creation of the FSO — while reflecting the inherent inadequacies of private and fragmented coordination — is partial and, as a result, unlikely to be wholly effective.
At the system level, investment in expanding clean generation capacity must be synchronised with proactive investment in the grid and interconnection infrastructure in order for capacity to be accepted onto the grid in the first place. Already, a lack of proactive coordination have led to bottlenecks holding back renewable deployment, which will only worsen as we move to the investment sprint necessary to deliver power sector decarbonisation goals. Likewise, investment in generation capacity must be coordinated with the expansion and maintenance of capacity in input supply chains, including labour, in order to physically build capacity in line with targets. Moreover, there are choices to be made concerning, for example, relative reliance on storage as opposed to excess generation capacity to meet grid balancing and demand in the context of the inherent variability of renewable generation.
Our electricity system is fully privatised from generation to supply. It is therefore highly fragmented, reliant on the price mechanism and profit imperative to coordinate service provision and investment by heterogenous private actors among and across the segmented markets for generation, transmission and distribution. As the following sections explore, this fragmentation makes coordination of investment challenging.
The grid is comprised of a set of private monopolies regulated by Ofgem, with these firms’ UK-based revenues derived primarily from charging a fee to users as a percentage of energy bills. With respect to delivering investment in grid infrastructure, Ofgem sets regulatory frameworks that are, in theory, designed to balance the investment requirements for maintaining and updating the grid with affordable prices for consumers against the financial stability and profitability of the company. This regulatory framework — titled “Revenue = Incentives + Innovation + Outputs” (RIIO) sets price controls for networks alongside rules regarding investment allowances.
As the following section explores, this regulated monopoly model has failed to deliver investment at the pace required to cope with the existing demands of the electricity system, let alone with the rapid transformation of that system to a decarbonised, renewable-dominated grid alongside rising aggregate demand. Based around jostling and incentivising private monopolies to deliver, this model lacks the coherence required to strategically manage investment in the grid, while simultaneously enabling an extractive corporate model that has seen billions paid out to shareholders. We then detail the financial accounts of National Grid PLC and its UK Electricity Transmission segment, as well as those of the DNOs in a subsequent section. Due to data limitations with respect to detailed cash flow statements, we exclude the two Scottish Transmission Operators — Scottish Hydro, ultimately owned by SSE, and Scottish Power, ultimately owned by Iberdrola — from the present analysis, with the intention to examine these firms in future analysis.
Within the RIIO framework, Ofgem sets investment allowances for firms based on expectations and decisions about investment needs, consumers costs and the firms’ “weighted average cost of capital”[28], with urgently needed investment placing upward pressure while the need to keep costs low for users exerts a strong downward pressure. The weighted average cost of capital approach implemented by Ofgem and its predecessor have come under heavy criticism from industry experts. Dieter Helm notes that at the point of privatisation, the purpose of the new network companies’ balance sheets was to finance, through private investment, the capital expenditure not paid for by customer bills.[29] Instead, through a series of errors in establishing the regulatory basis for private ownership and investment, Helm argues “the companies discovered the best way to make lots of money was to exploit the way OFFER [the predecessor of Ofgem] and Ofgem set the cost of capital.” Per Helm, rather than setting an allowance for debt and for equity financing separately, the regulations combine the two in such a way that it became “a financial no-brainer to leverage up the networks, effectively mortgaging the assets and extracting the upside through special dividends, buybacks, and inflated profits.”[30]
In November 2022, National Grid announced it was investing up to £9 billion in UK energy transmission improvements in the five years from 2021-2026, with a stated goal of “improving connections to green energy”.[31] A further £6 billion is potentially committed to National Grid’s UK distribution business over this period. This amounts to a maximum of £1.8 billion per year in the UK’s transmission network. According to the firm’s accounts, actual gross capital investment in UK electricity transmission for 2022/23 was just under £1.2 billion.
To put these figures in greater context, according to recent analysis by Carbon Tracker, while deployment rates of wind and solar generating capacity have increased fourfold over the past decade, investments in the transmission network have flatlined over the same period, and indeed began to decrease in real terms from 2017.[32] Using data from the International Energy Agency, Figure 2, below, highlights the stalling pace of investment in UK transmission and distribution since 2015.
[.fig]Figure 2: Stagnating Investment in UK Transmission and Distribution Networks Since 2015[.fig]
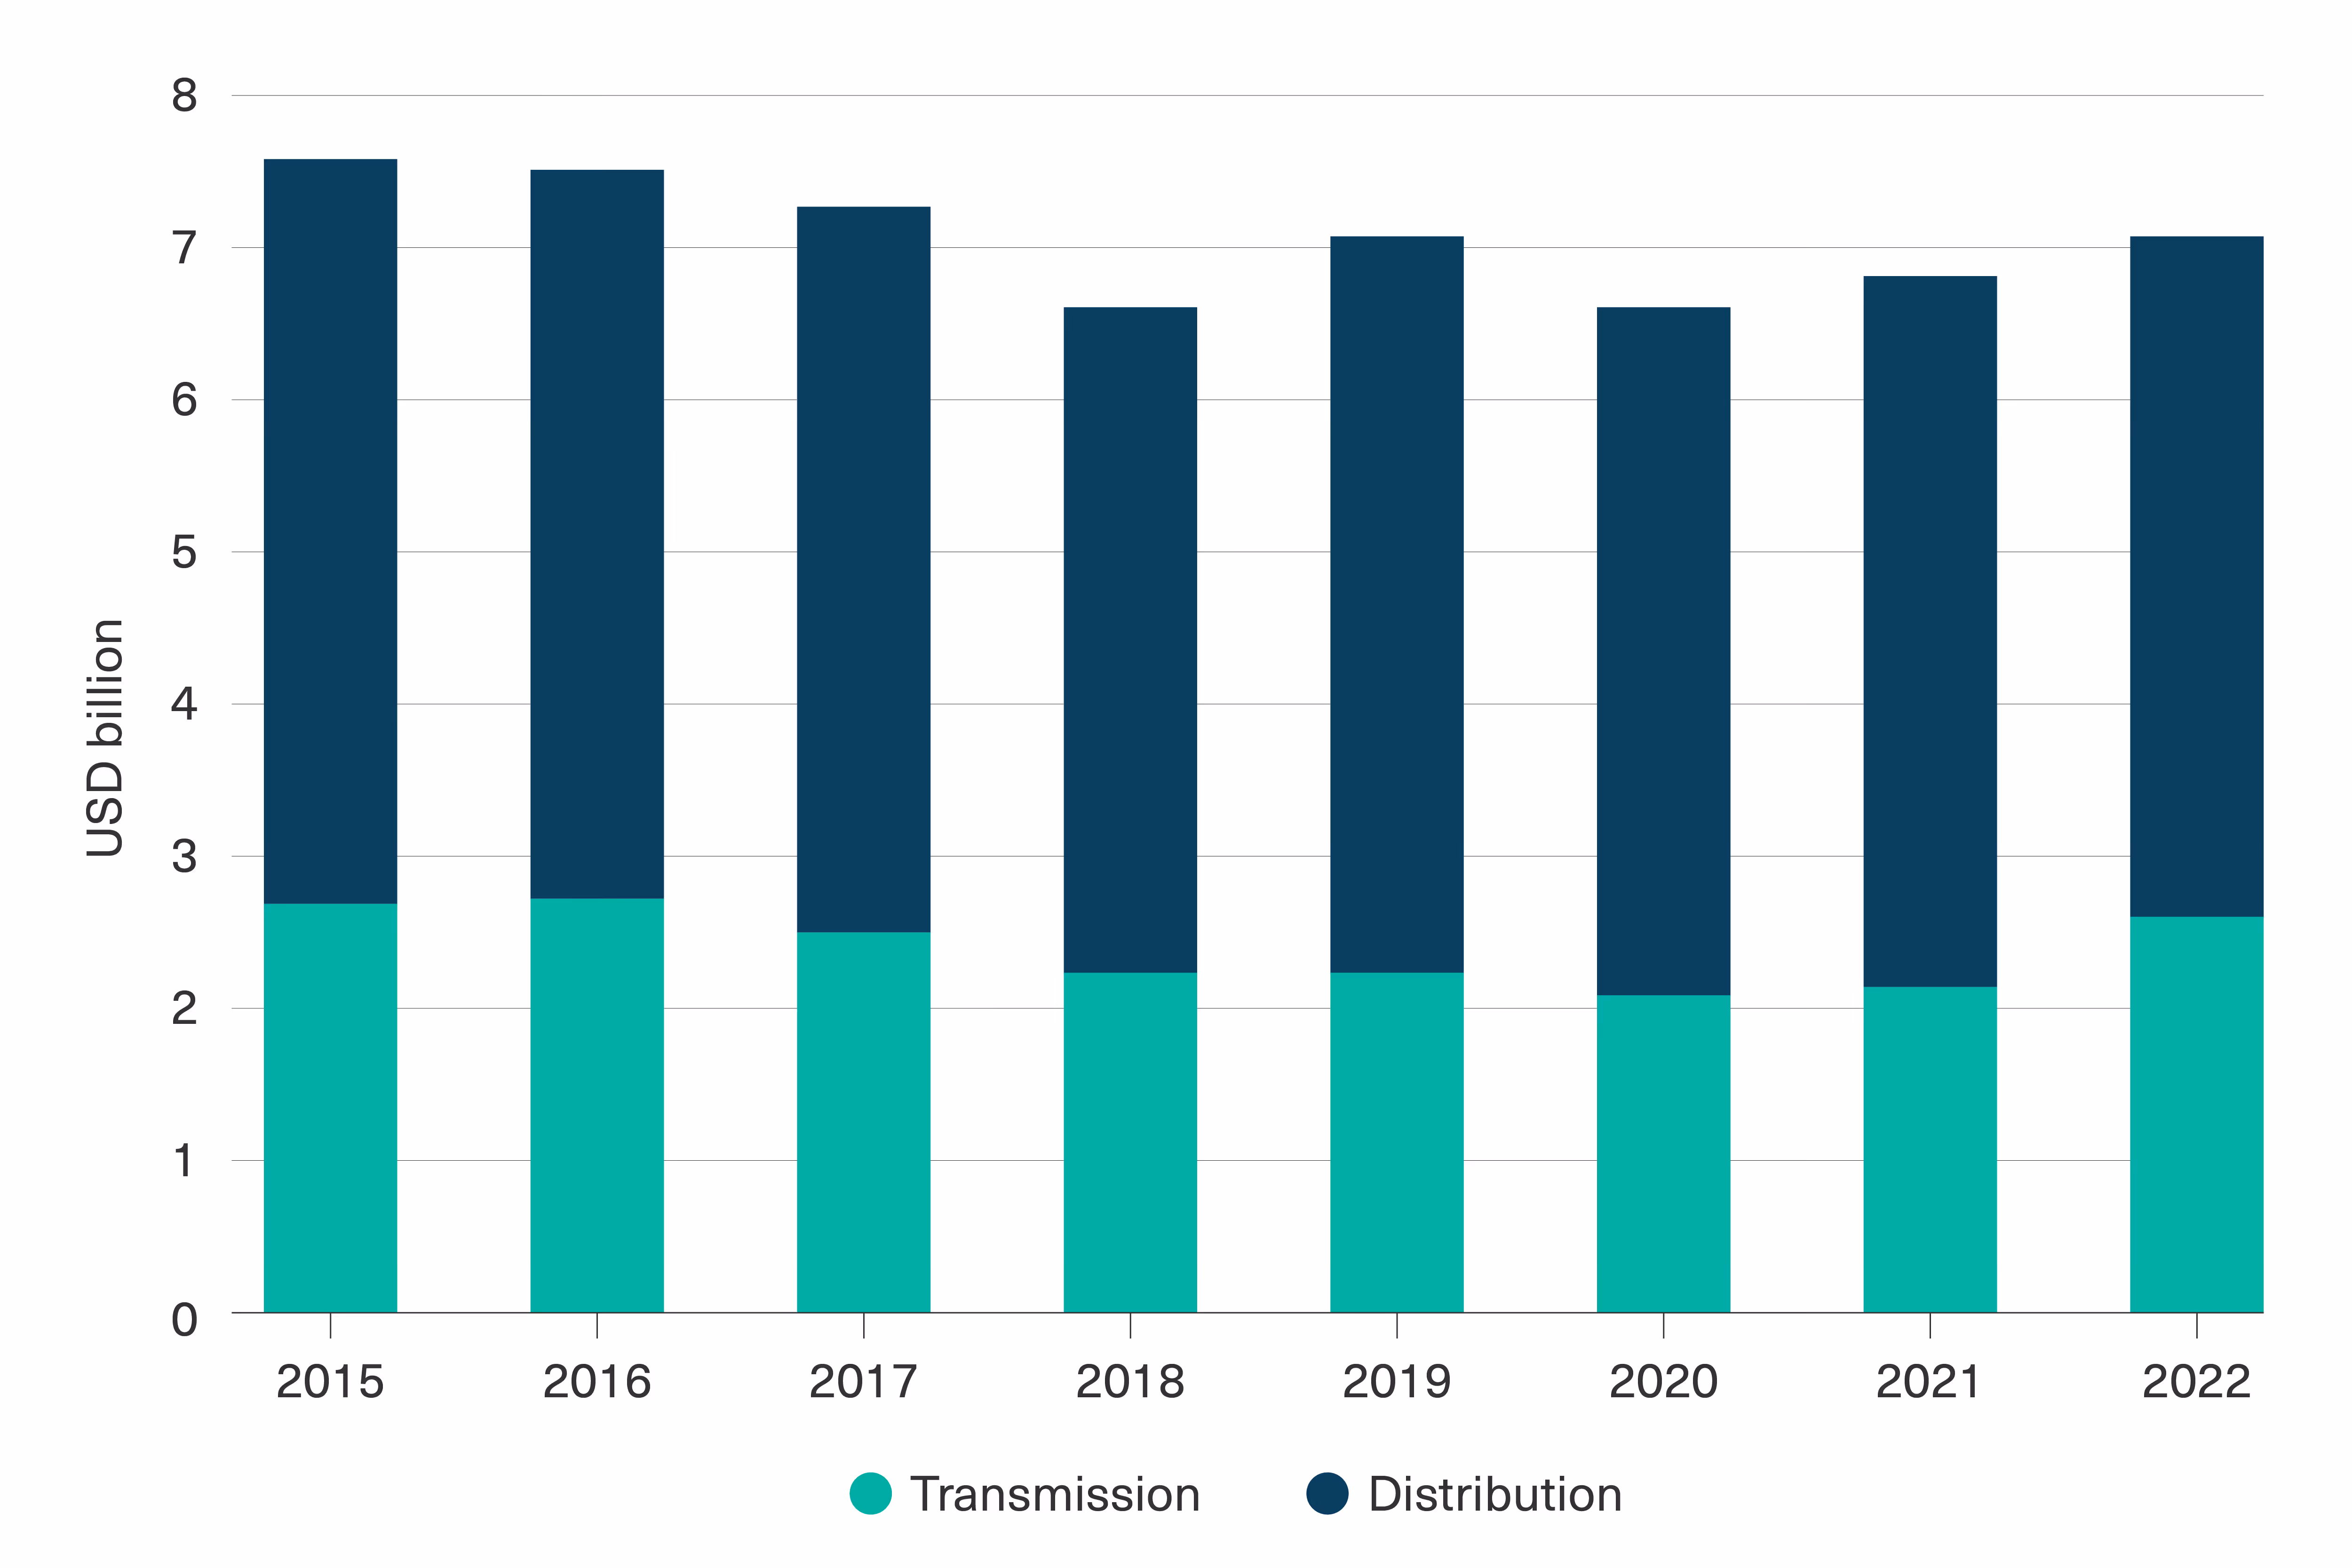
[.notes]Source: Common Wealth via International Energy Agency[.notes]
In short, investment in the grid is failing to keep pace with the escalating demands of the transition to renewables, reflecting the critical challenges of building a grid compatible with the demands of a renewable energy-dominated electricity system and an electrified economy more broadly while leaving the networks in private monopoly ownership and therefore organised around maximising returns for shareholders.
National Grid is presently required to manage connection requests on a first come, first served basis, meaning that projects that may already have planning permission and are “shovel ready” can lag for years behind those that do not, and may face years of additional planning debate before a decision. This process plays a significant part in the years long delays many renewable projects face when attempting to connect to the grid. However, as discussed in “The existing cost of underinvestment” below, planning and consenting complexities are not the sole driver of the lengthy grid connection queue.
At the end of last year, in recognition of the widening gap between connected generating capacity and targets for new capacity, Ofgem published a new regulatory framework — Accelerating Strategic Transmission Investment (ASTI) — to accelerate the buildout of the onshore grid capacity required by 2030, in part through changing competition requirements, investment allocation rules and regulatory processes for specific transmission projects deemed vital to the 2030 target. The framework identifies 26 transmission upgrade projects, and estimates that these upgrades will require £20 billion in investment by 2030 on behalf of the three Transmission Operators: National Grid, Scottish Power Energy Networks and SSEN Transmission.[33] Any projects outside these 26 remain within Ofgem’s prior regulatory framework, Large Onshore Transmission Infrastructure (LOTI), within which projects typically take around 11-13 years from identification of project need to project completion.[34]
While the decision to implement ASTI has been received as a recognition of the need for a streamlining of the regulatory, planning and consenting processes for new projects, we contend that it contained a recognition of a more fundamental problem with the way the electricity system is currently articulated: via market coordination with jostling by regulator input and state-backed incentives. Importantly, this view appears to be echoed by Ofgem, whose publication on the new framework contained a clear recognition of the inadequacies of current planning, investment and regulatory frameworks for the task of grid decarbonisation (our emphasis added):
Delivering the Government’s ambitions will require a step-change in the way large onshore transmission projects are delivered with an unprecedented level of network infrastructure required up to 2030… ASTI should be seen as part of a departure from traditional incremental network build towards a more co-ordinated, top down network planning approach. We consider that this new approach can better deliver the required network upgrades on a more programmatic basis.[35]
In short, the piecemeal process of incremental grid improvement that has prevailed to date has been and will continue to be totally inadequate for the demands of delivering a secure, clean and affordable energy system at the necessary pace and scale. This raises a significant question about the justification for a private-sector owned and operated grid, with supposed market cost efficiencies and the redundancies inherent to top-down coordination typically invoked as reasons to prefer a privatised system.
By contrast, the substantial and costly ongoing delays to grid connection, the above reflections from Ofgem and the decision to establish a public Future System Operator (FSO) in order to oversee long term strategic coordination of the energy system strongly suggest that the privatised model is at breaking point, with ever-escalating public sector involvement required to deliver the transformation of this vital system while still maintaining private ownership.
However, from what can be gleaned from published documents about the FSO, the proposed body will lack any directive powers, with its mandate instead limited to a data analytical and advisory role. Thus, the inability of the FSO or any other actor in the current ecosystem of UK public institutions to compel or undertake direct investments in the electricity system means that critical investment in generation capacity and supporting infrastructure cannot be guaranteed to be undertaken at all, let alone in the necessary sequence, pace, or geography to proactively smooth bottlenecks that could stymie or delay further investment by both public and private actors.
Public planning and coordination must be able to overcome the fragmentation of ownership and privatisation of investment decision-making throughout the electricity system. Socialising the investment decision function through the capacity to undertake direct investment in transmission is essential for delivering power sector decarbonisation targets. Full public ownership is also a bulwark against the risk that private sector participants may not deliver those network projects deemed unattractive from an investment return perspective even where these are essential from a network planning and delivery perspective, leaving the public sector to fill in the gap — thereby socialising the downside while privatising the upside.
Moreover, as outlined above and as explored in the National Grid Financial Accounts and Ownership Summary, below, there are serious reasons to doubt the claims to major cost savings through private sector ownership, which entails higher borrowing costs relative to the public sector; billions in dividend payments; and, by taking advantage of how weighted average cost of capital is regulated, maximising gearing to reward shareholders.[36]
Britain’s grid was largely built in the 1960s and was designed to transport power from large single source coal and nuclear plants, typically located in the north of England, to areas of greater demand, primarily in the south.[37] As described above, the transition to a decarbonised electricity system and economy as a whole means the grid now faces a very different set of pressures than those for which it was originally designed. As an indication of these pressures: the annual level of transmission connection requests to National Grid in 2021/22 increased by approximately ten times the level five years prior (Figure 3).
[.fig]Figure 3: Connection Requests Have Exploded in Recent Years[.fig]
[.notes]Source: National Grid ESO via Schroders[38][.notes]
To view the challenge from another angle: Figure 4, below, shows the total generating capacity in the TEC register, which records generation and storage projects (both built and anticipated) with contracts to connect to the grid — in other words, projects in “the queue” to connect.[39] The figure highlights the enormous increase in new connected capacity anticipated between now and 2040 based solely on those projects that have already been initiated. Thus, the figure is likely an underestimation of the actual increase, as many projects are likely to be built that are not yet recorded in the TEC register.
[.fig]Figure 4: Capacity in the Grid Connection Queue by Year of Completion (GW)[.fig]
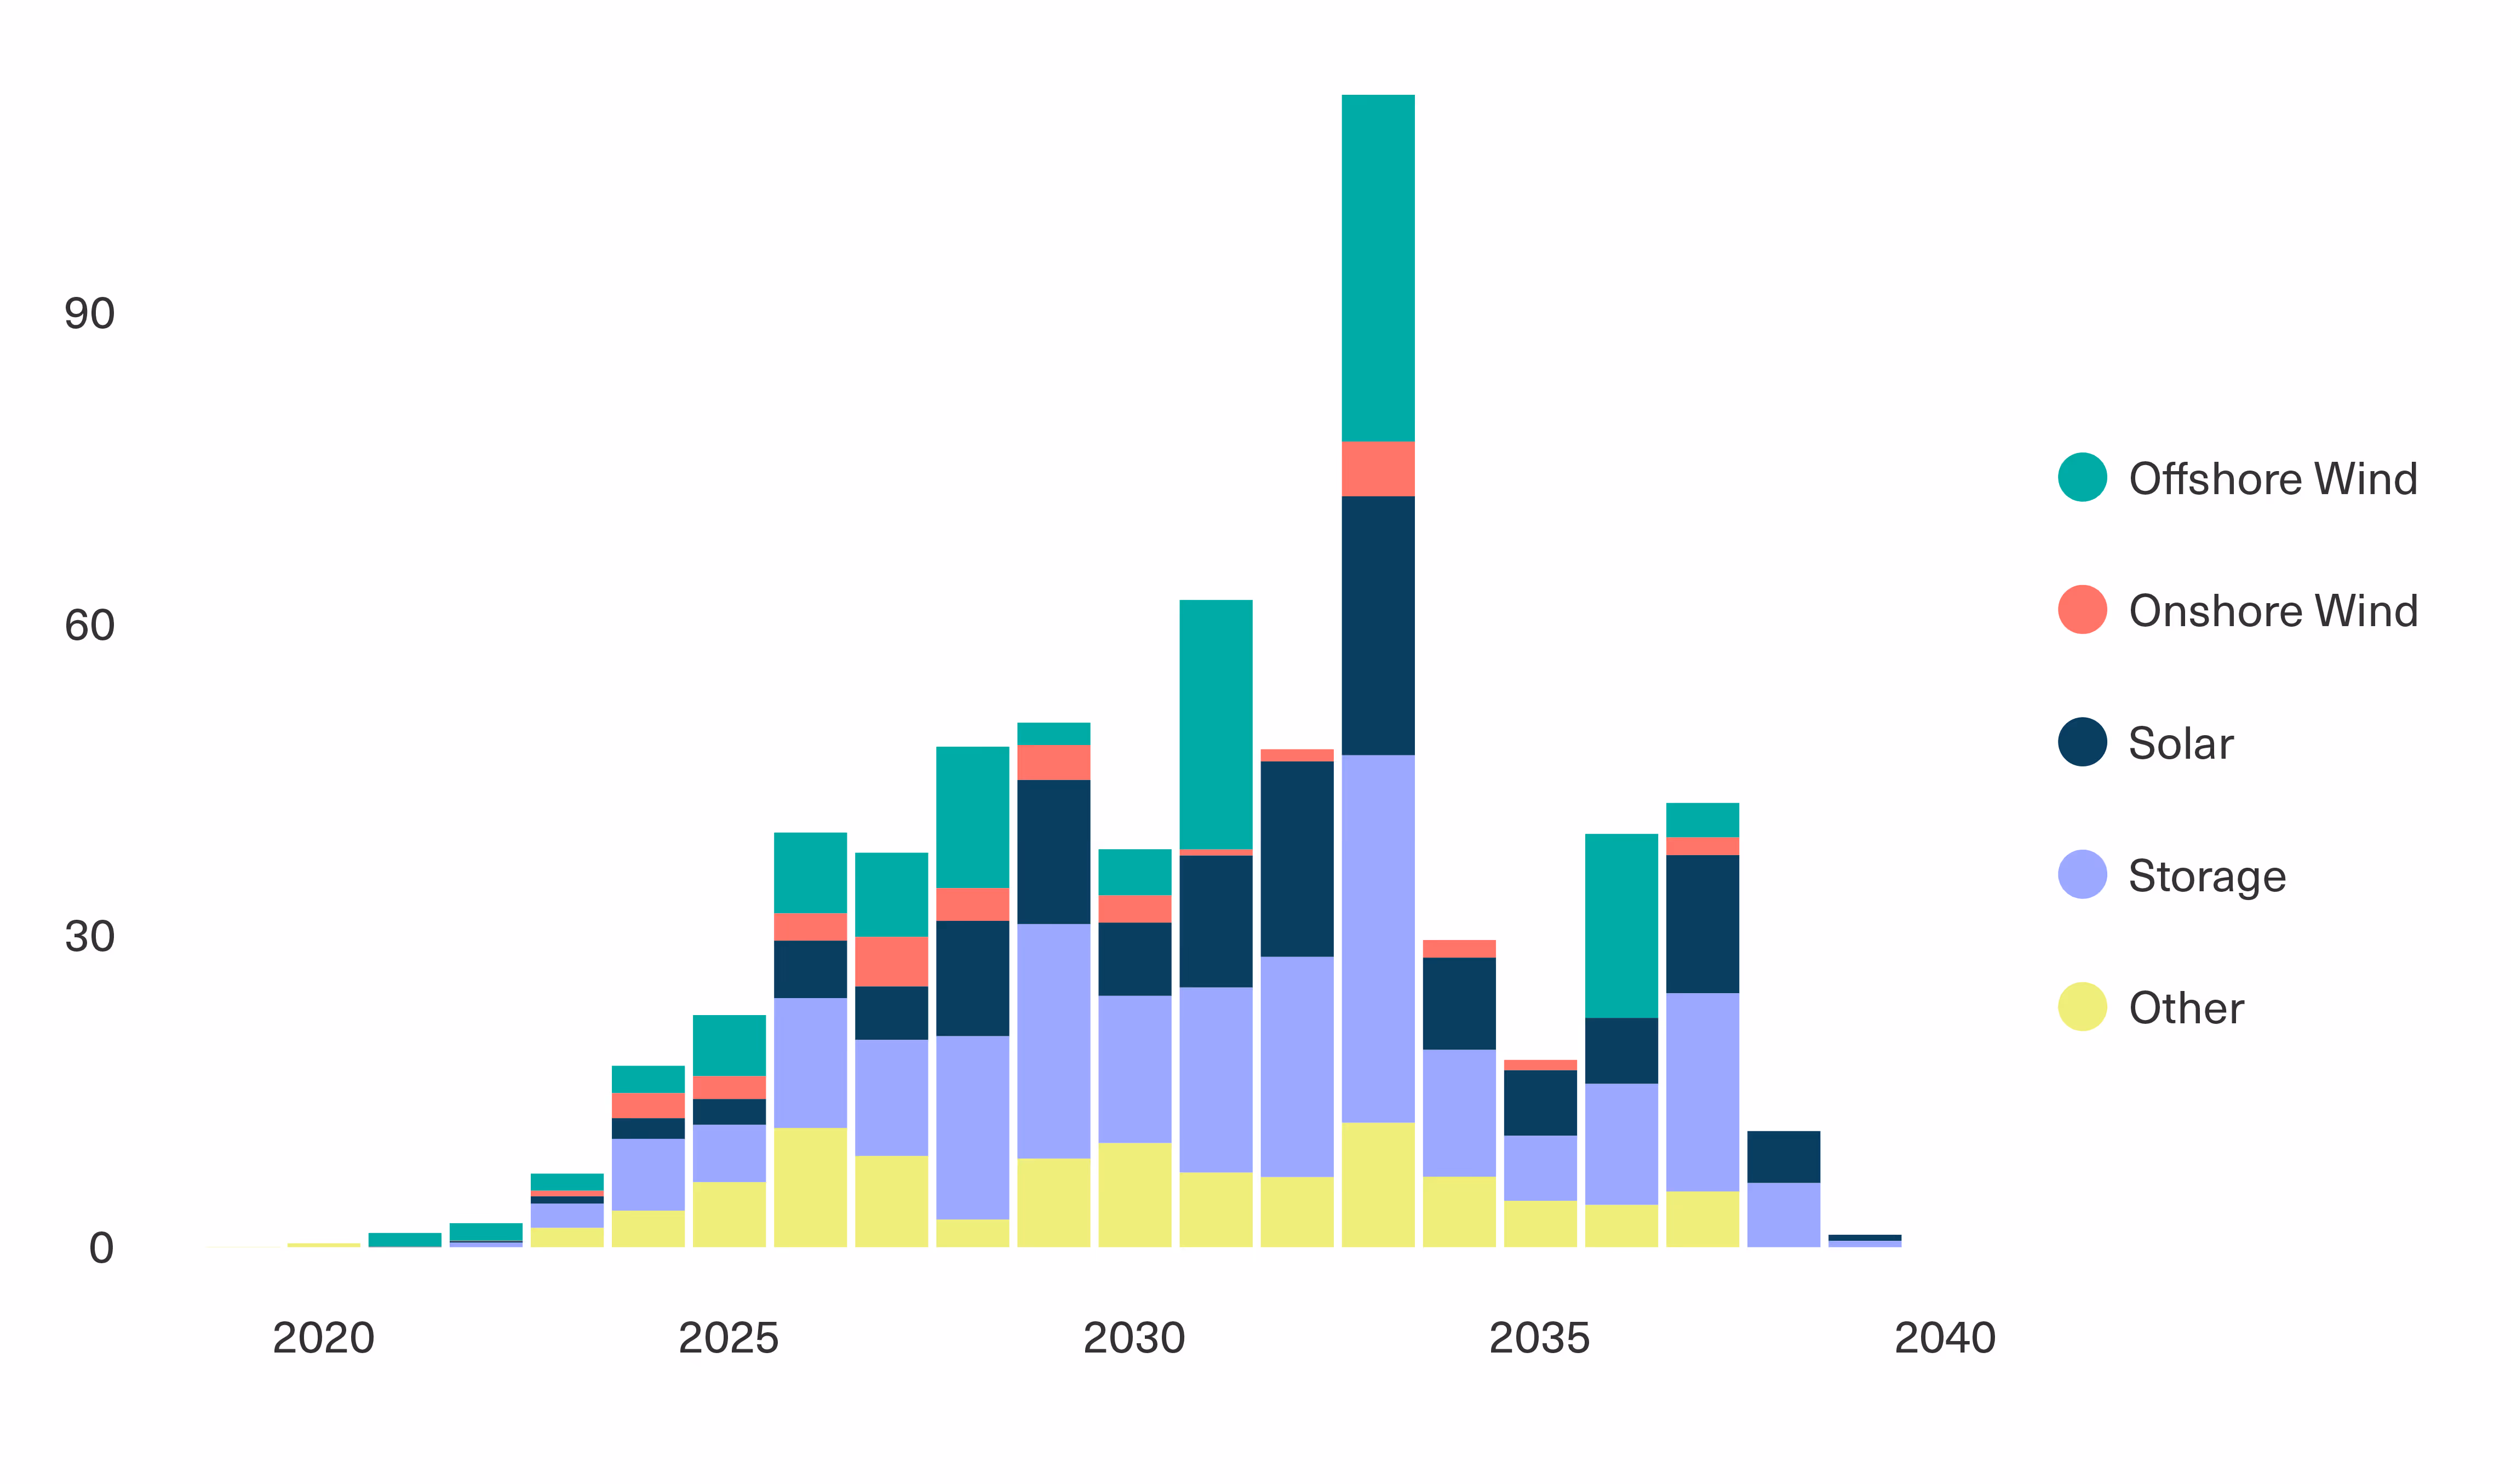
[.notes]Source: Common Wealth analysis of National Grid ESO Transmission Entry Capacity Register.[.notes]
Currently, wait times for connections to the grid average up to 13 years from the initial stages of a project.[40] The result is that there are currently 600 renewable and battery storage projects with a combined capacity of 176GW in the queue in England and Wales alone according to National Grid, compared with just 64GW of connected capacity in these technologies. In part, this reflects challenges and hold-ups resulting from planning and regulatory processes; however, according to industry and experts, much of the delay relates to inadequate grid capacity to stably handle the electricity generated by these new projects.[41]
Even before the challenge presented by a massive buildout of new connections, however, the grid is already struggling to keep up with existing demands and connected capacity — a problem that is distinct to the bottleneck of the planning and consenting processes that are often cited as the bottleneck for grid decarbonisation. Ofgem regulates the maintenance expenditure and capital investment budget of the transmission and distribution networks by establishing agreed targets; however, expert analyses have suggested these may often be inadequate or unmet.[42] Insufficient investment in maintenance has been linked to several blackouts and grid issues in recent years.[43] Critically, as demand continues to rise, the pressure placed on aging networks is increasing their tendency to “leak”, resulting in a loss of roughly 25 terawatt hours in 2022 — equivalent to the total quantity of energy imported to the UK this year.[44]
Further, as recently noted in an analysis by Carbon Tracker: “due to the limited capacity of the cables connecting the different areas of the country… a growing share of green electricity is being wasted while gas plants are increasingly called to compensate for this loss during so called wind congestion events.”[45] As a result, £1.5 billion — or £77 per household — has been paid out since January 2021 in wind power curtailment costs alone, which compensate wind farms for curtailing their generation when the grid is unable to accommodate it. Carbon Tracker calculates that the amount of wind power curtailed in that year was equal to the annual consumption of one million households.[46]
These costs are paid for via the “Balancing Services Use of System” charge on consumer bills. Thus, British energy users are already paying the substantial cost of ongoing grid congestion through their energy bills, which will only continue to escalate without a step-change in investment in new grid capacity. Carbon Tracker’s analysis projects these costs could rise to £3.5 billion annually, equivalent to £200 per household (Figure 5).[47]
[.fig]Figure 5: Projected Wind Congestion Costs[.fig]
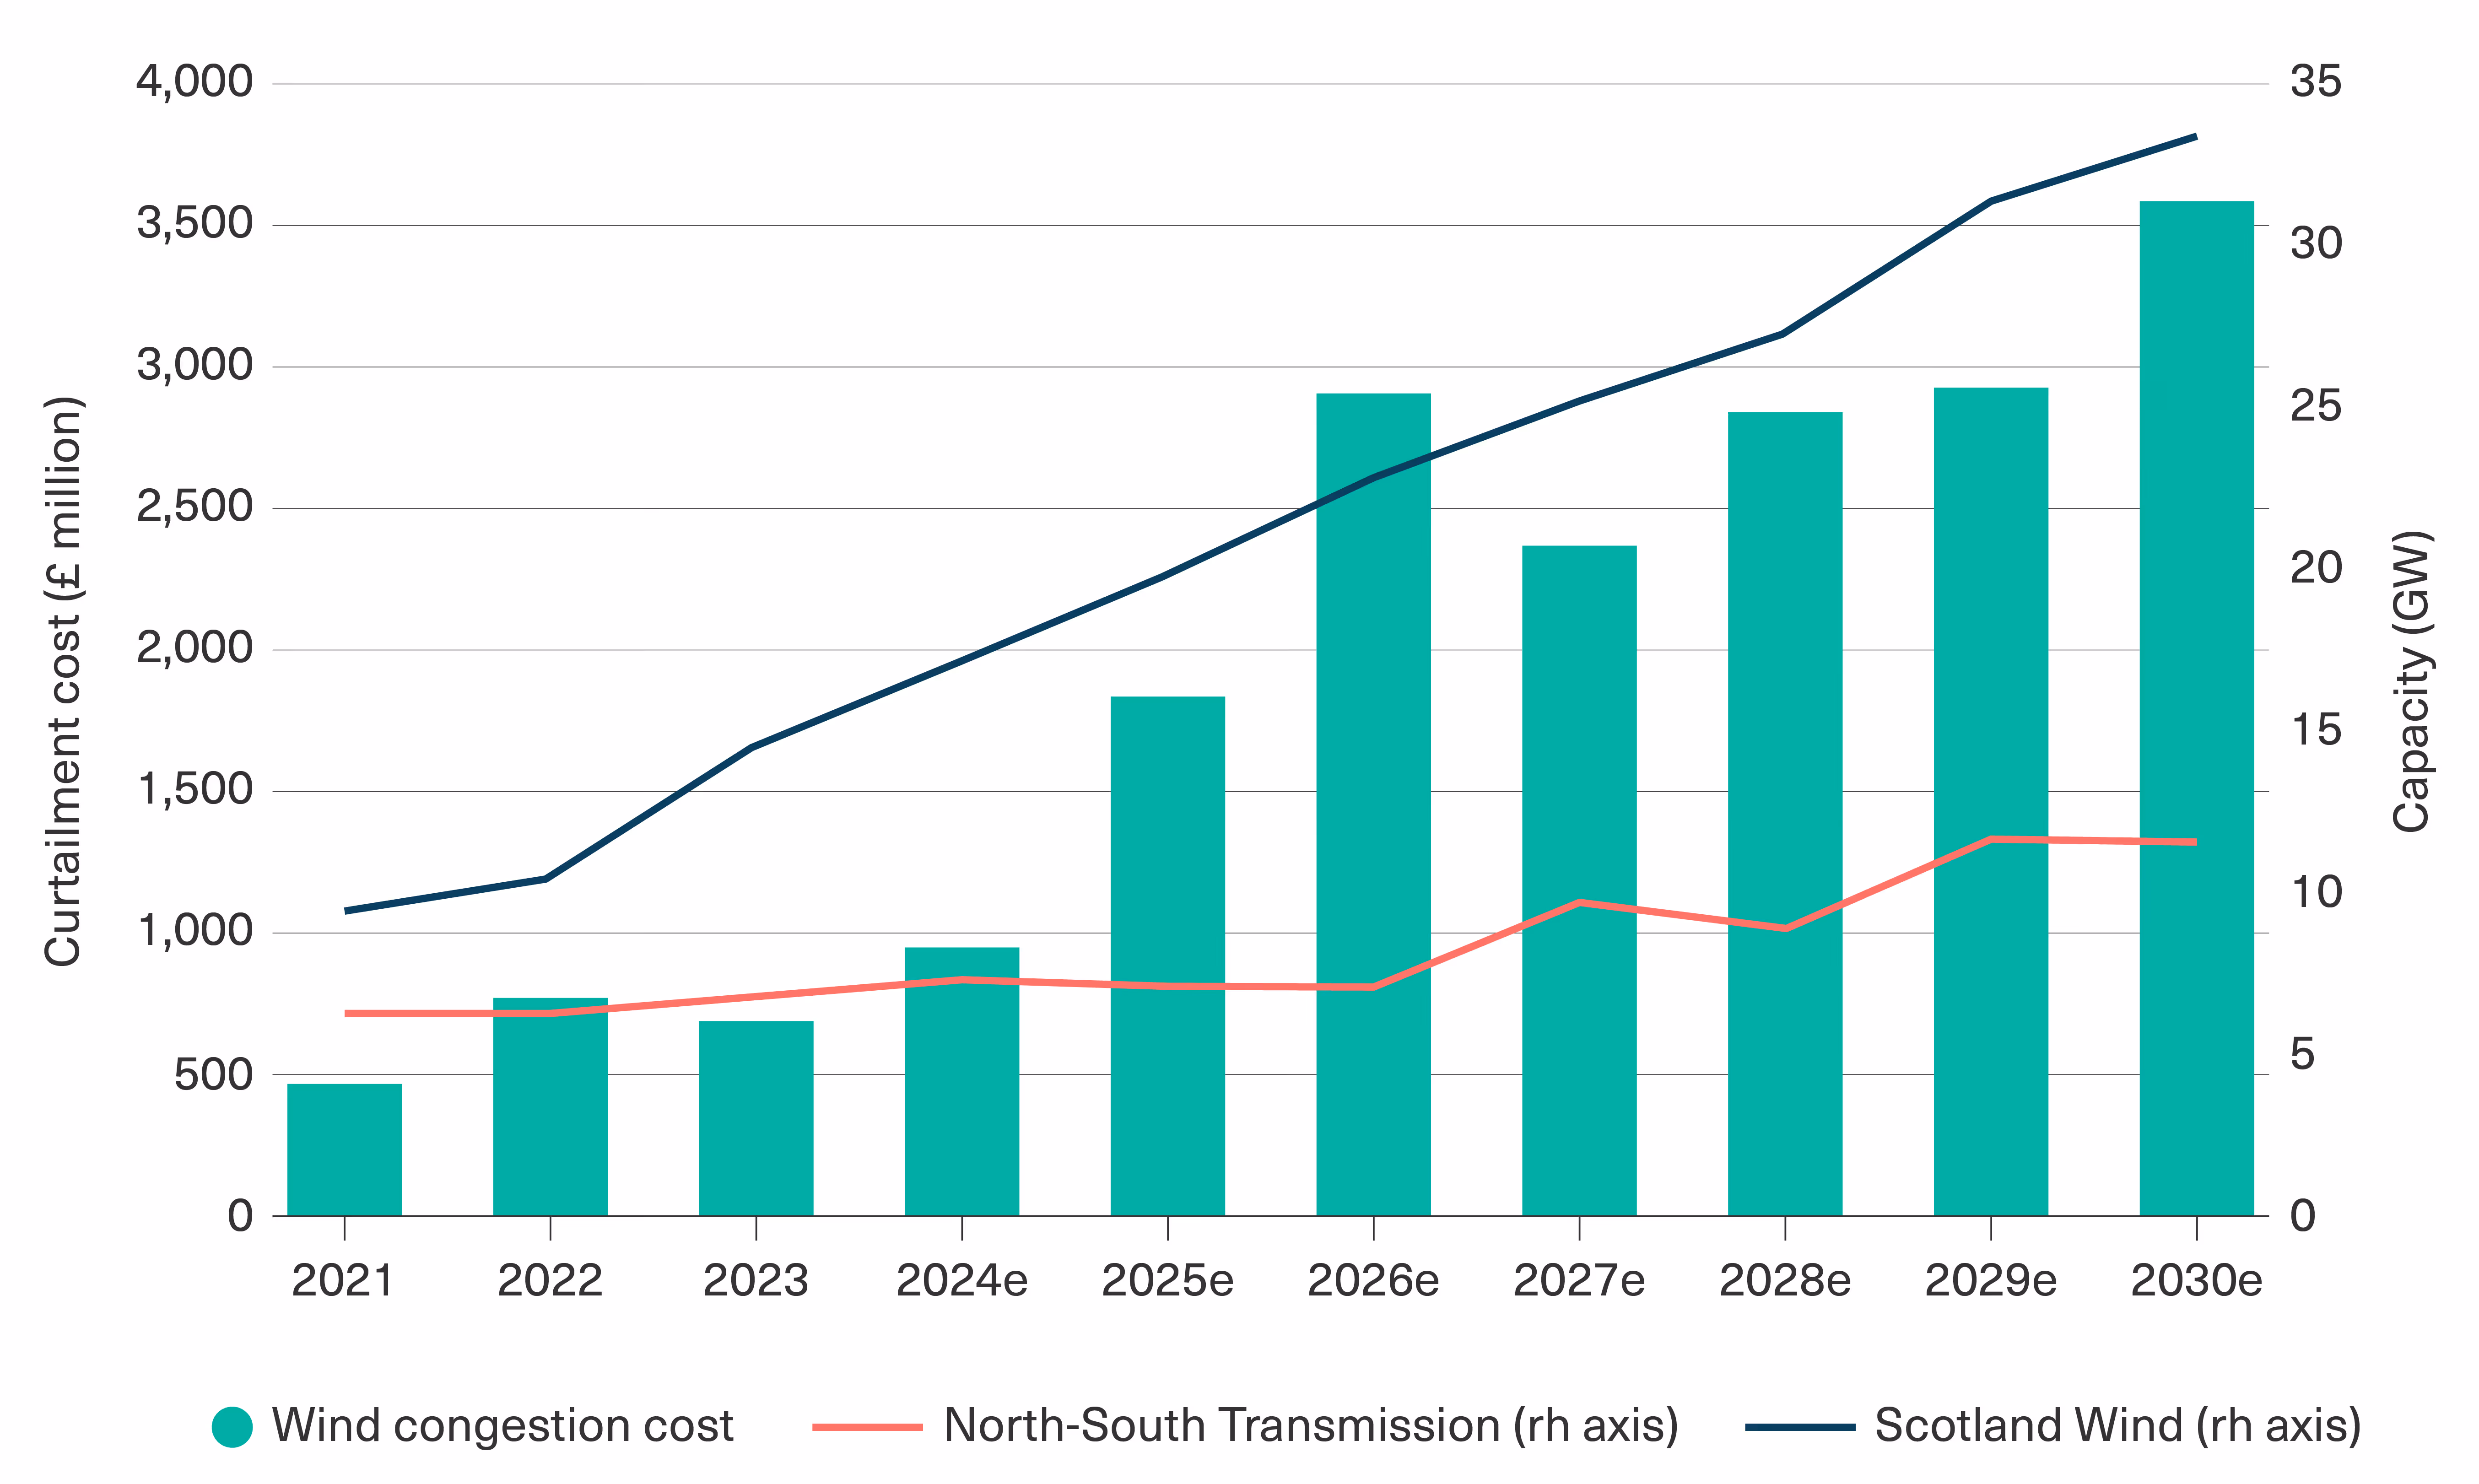
[.notes]Source: Carbon Tracker[48][.notes]
Figure 6, below, highlights the annual cost of “thermal constraints”, which refer to periods when electricity in the grid must be constrained to the risk of overheating — a problem that could have been mitigated by greater investment in transmission capacity.
The National Audit Office estimates that the ongoing cost to the public of the various “constraint costs” across the whole of the electricity system, which are incurred when generators are compensated for curtailing electricity production that the grid is unable to accommodate, total up to £62 million per day, or £1.94 billion in 2022.[49]
[.fig]Figure 6: Annual Constraint Costs (£ Billion)[.fig]
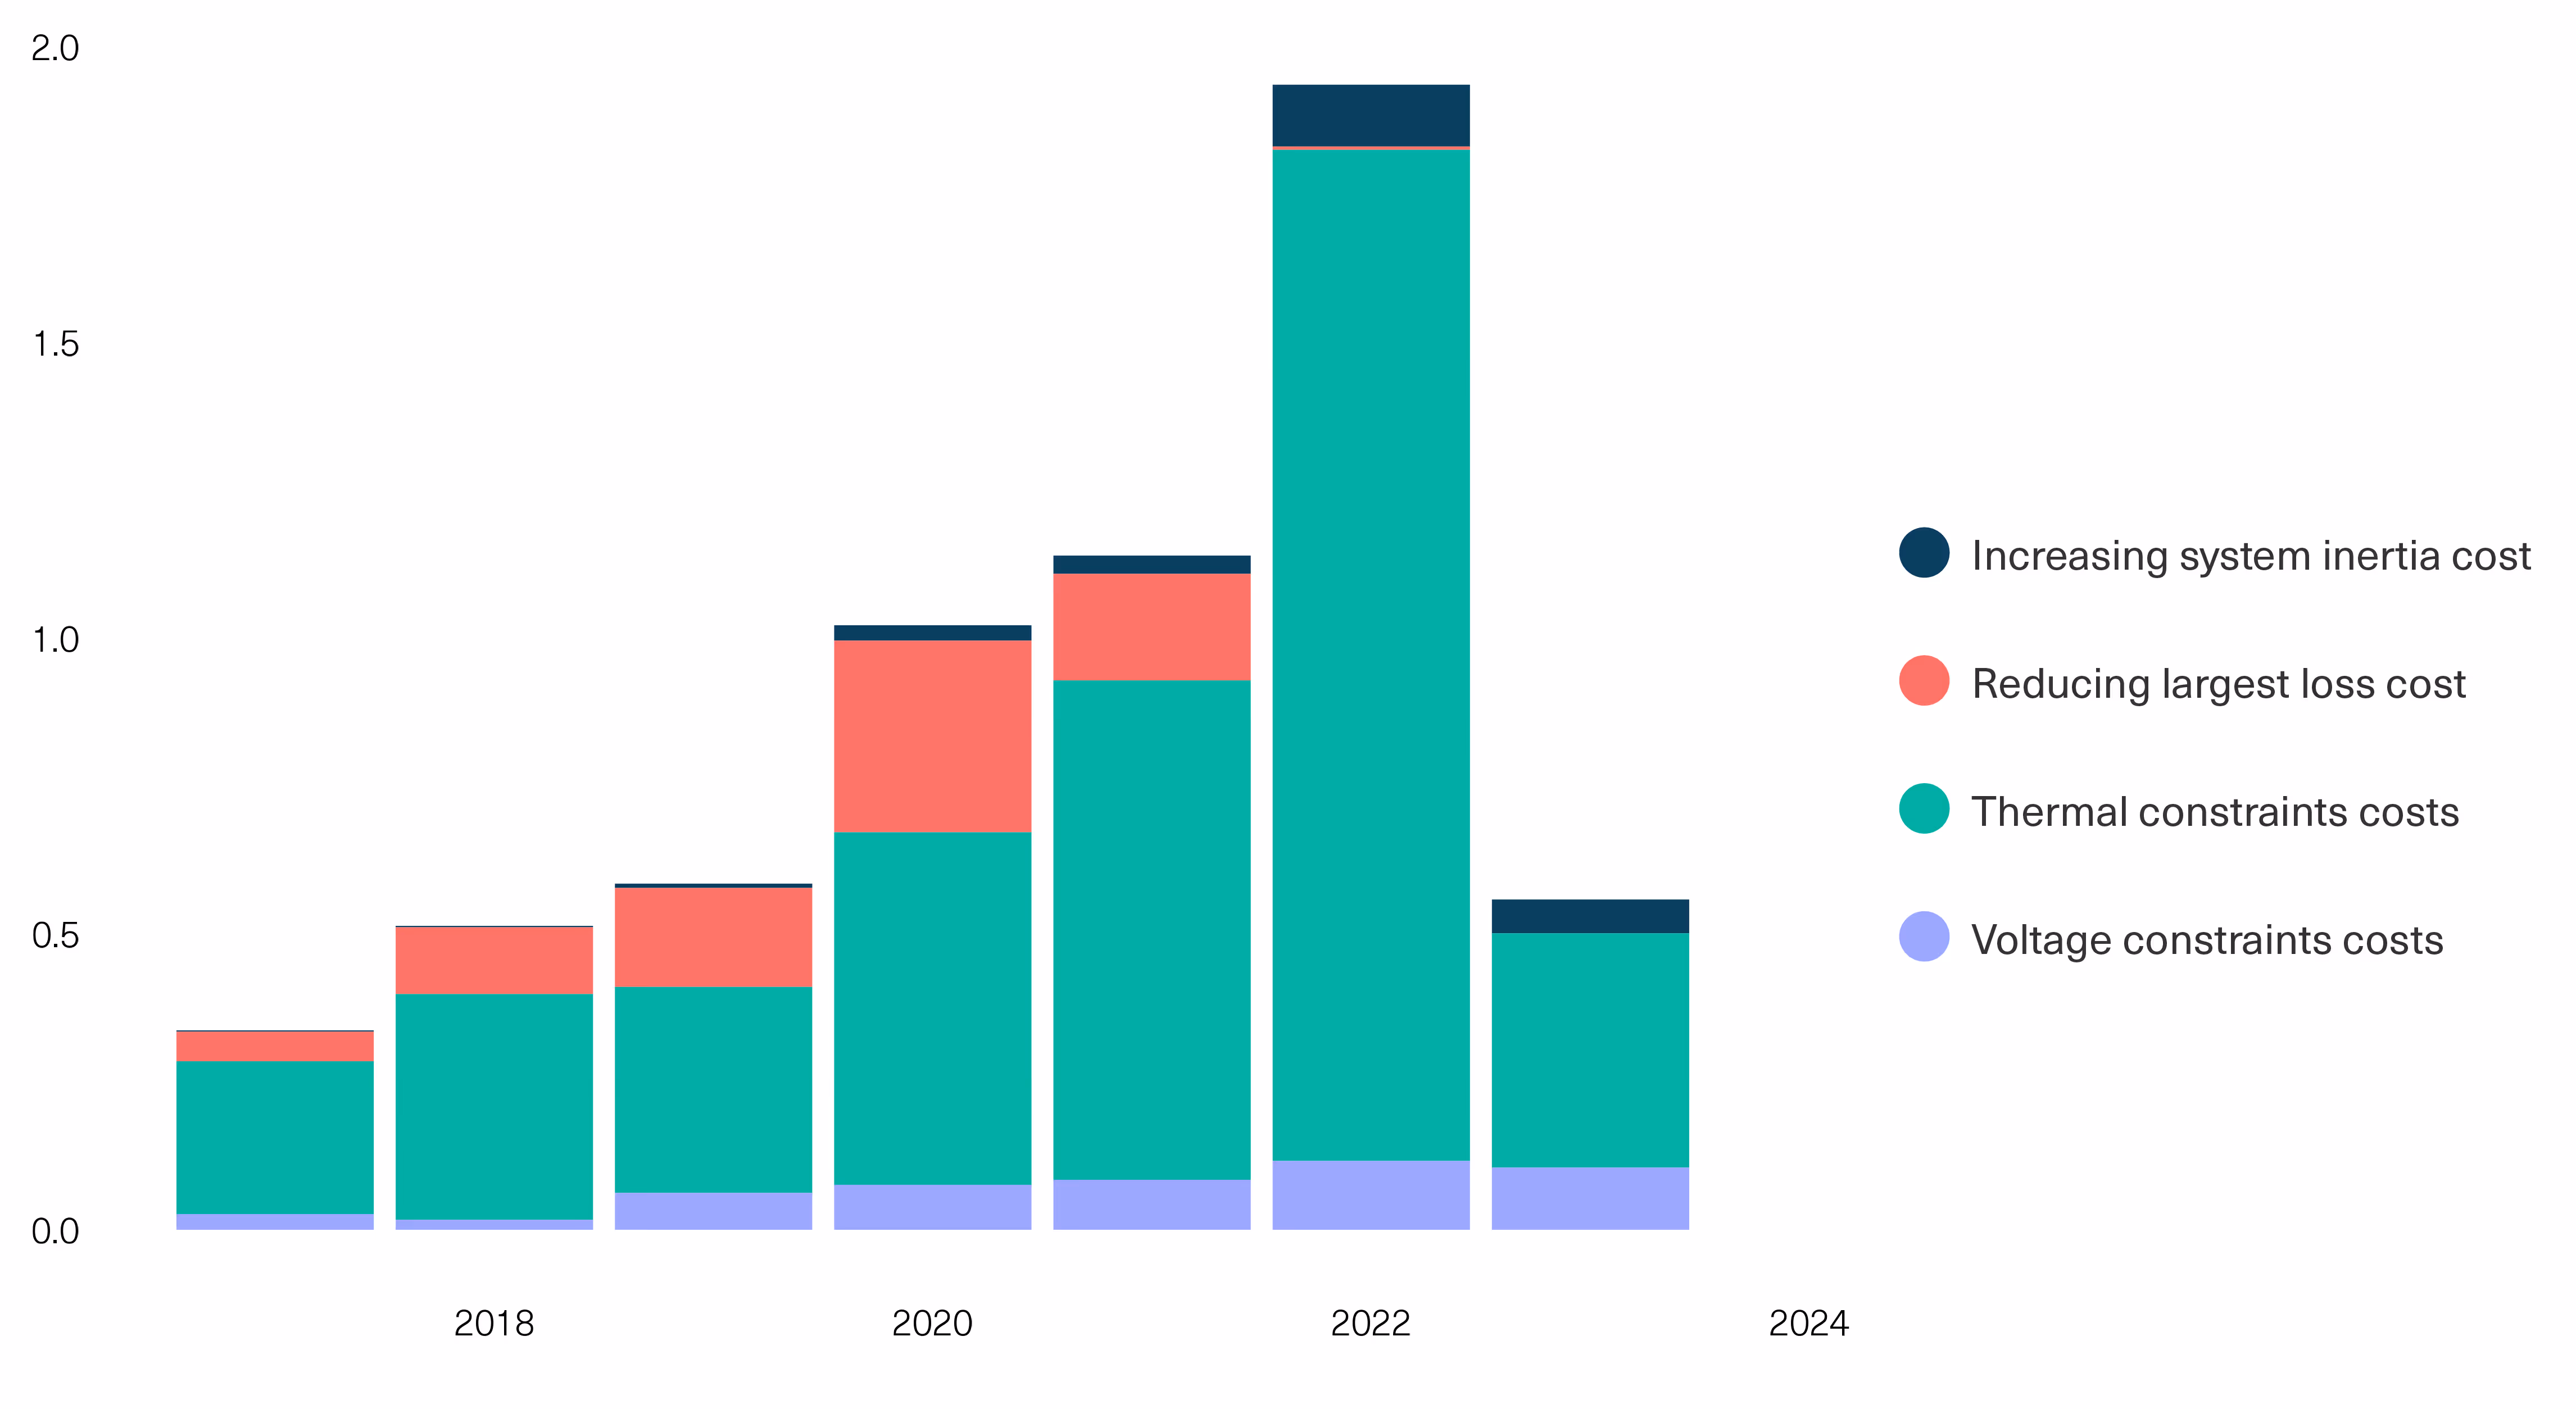
[.notes]Source: Common Wealth analysis of National Grid ESO.[.notes]
The current government target for a decarbonised electricity system is 2035. To meet this target, the Government plans to deliver 50GW of offshore wind by 2030 — increasing existing capacity by four times in just seven years — and increasing solar capacity by five times by 2035.[50] According to recent estimates by National Grid, the new transmission infrastructure required to meet this buildout over the next seven years is five times what was delivered over the past thirty years.[51]
At present, the UK public pays for the grid — both the normal operations and investment of transmission and distribution companies — through their bills in the form of “network costs”, which average 20% of an average household bill. In the summer of 2022, when the price cap was an average £1971, network costs were estimated at £371 pounds annually per household.[52] Within this, £68 was attributable to a levy imposed on energy users to cover the cost of collapsed suppliers following the spike in global gas prices. The price cap today remains at a comparable level — just over £1800 — implying these estimates of network costs remain current. Figure 7, below, shows the relative contribution of network costs to the average electricity bill over since 2018.
[.fig]Figure 7: What's in a Bill? Network Costs Contributed Roughly 20% to Energy Bills This Year[.fig]
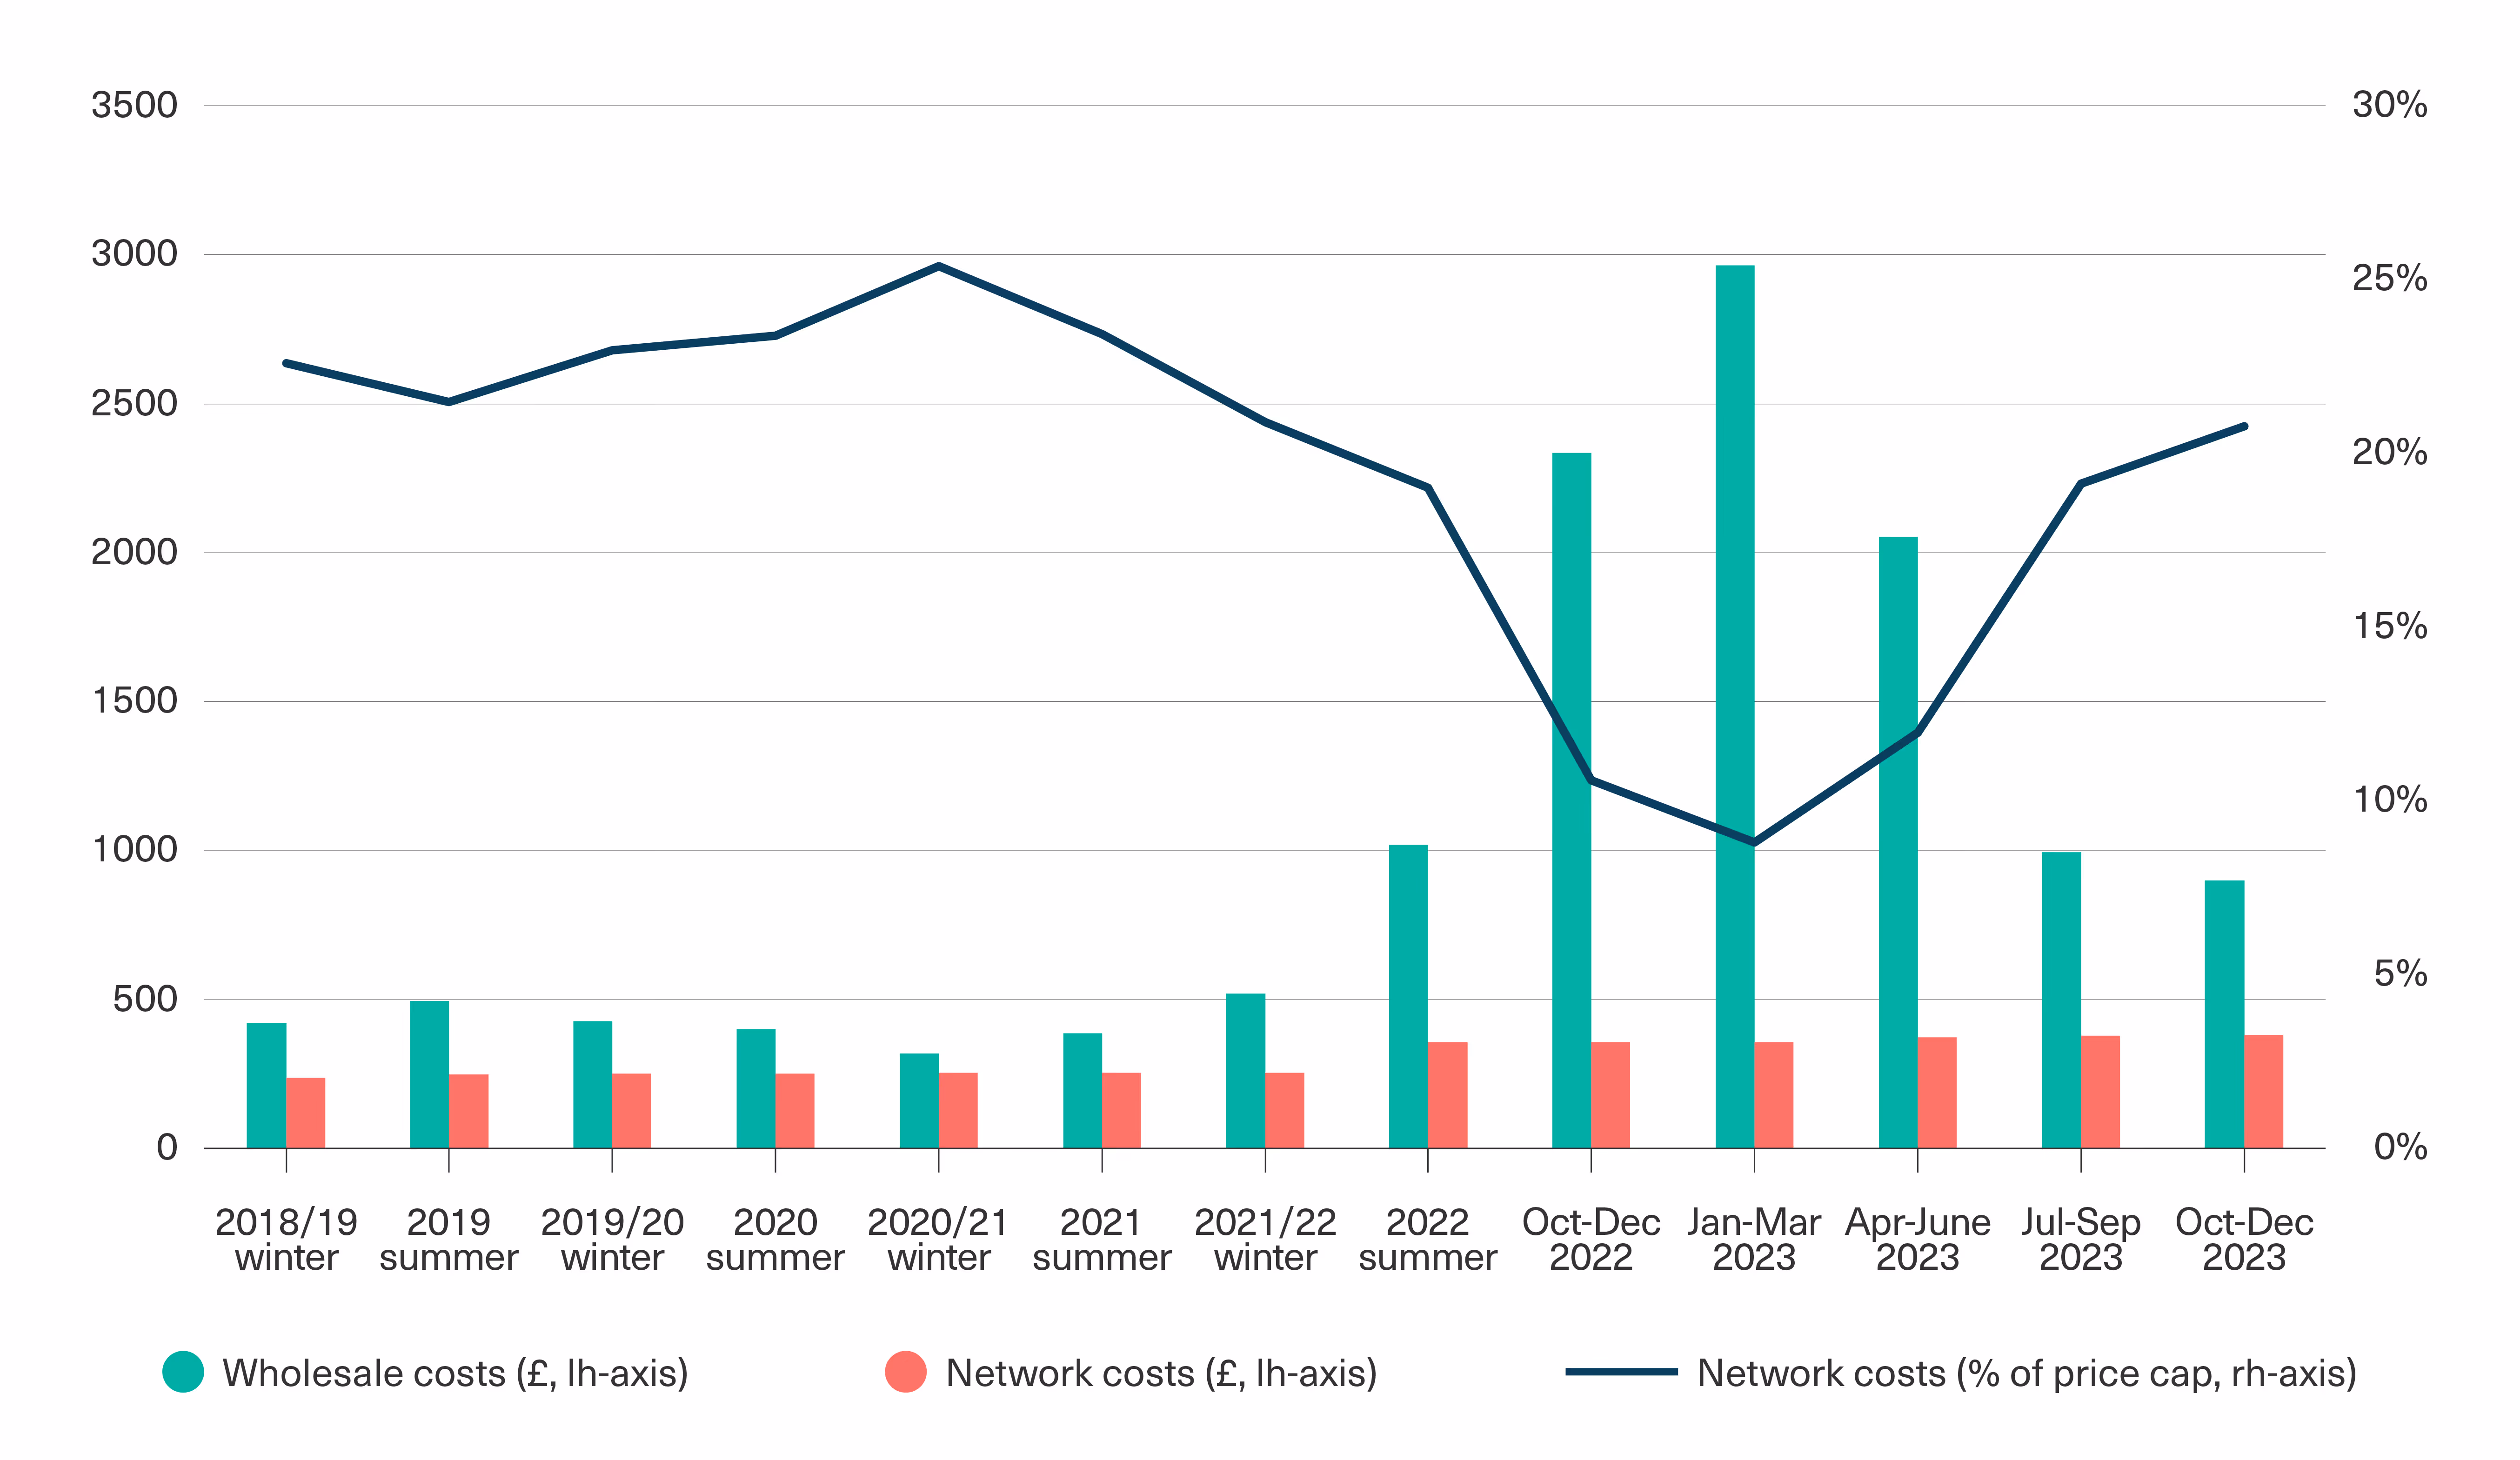
[.notes]Note: Figures show contributions to Ofgem direct debt price cap. Source: Common Wealth analysis of Ofgem.[.notes]
In the following, we present figures from the accounts of National Grid PLC and its wholly owned subsidiary National Grid Electricity Transmission, which owns and operates UK electricity transmission. All figures are based on Common Wealth analysis of LSEG Refinitiv unless otherwise indicated.
[.fig]Table 1[.fig]
*Due to differences in reporting, Capital Expenditure for plc is net, for NGET is gross
National Grid’s interest payments on its outstanding debts were equivalent to 22% of the firm’s net capex over the last decade. National Grid’s most recent ten-year bond issue was in on 15 September 2023 at a yield of 6.388%. By comparison, the UK ten-year gilt yields on that day were around 4.35% — a spread of two percentage points.
Since privatisation, National Grid plc has paid a total of £27.8 billion in dividends and another £600 million in share buybacks net of issuance (including UK and US segments) — averaging nearly £1.6 billion per year over the last decade.
Segmental cash flow accounts show that National Grid’s UK Electricity Transmission business segment alone paid out nearly £4.2 billion in dividends over the past decade, averaging nearly £420 million per year. This is equivalent to 40p in dividends for every £1 in gross capital expenditure (investment) for this segment.
The scale of National Grid’s dividends is regulated by Ofgem under the allowed “cost of equity” in the RIIO framework. It is worth noting that under public ownership, the imperative to remunerate shareholders with large dividend payouts would be eliminated, drastically reducing the cost of equity and saving billions in the coming years as we race to decarbonise the grid.
In late 2022, National Grid committed up to £9 billion in investment in UK electricity transmission in the five years from 2021-2026, equivalent to £1.8 billion per year. Actual gross capital expenditure in the UK electricity transmission segment since 2021 has averaged £1.1 billion per year.
By comparison, extrapolating National Grid plc’s average annual dividend payment from the last decade would imply the company paying out nearly the same amount — £7.8 billion — in dividends over the same period. Similarly extrapolating dividends for UK Electricity Transmission alone would nearly £2.1 billion over those same five years.
[.fig]Figure 8: National Grid Electricity Transmission: Dividends Relative to Investment
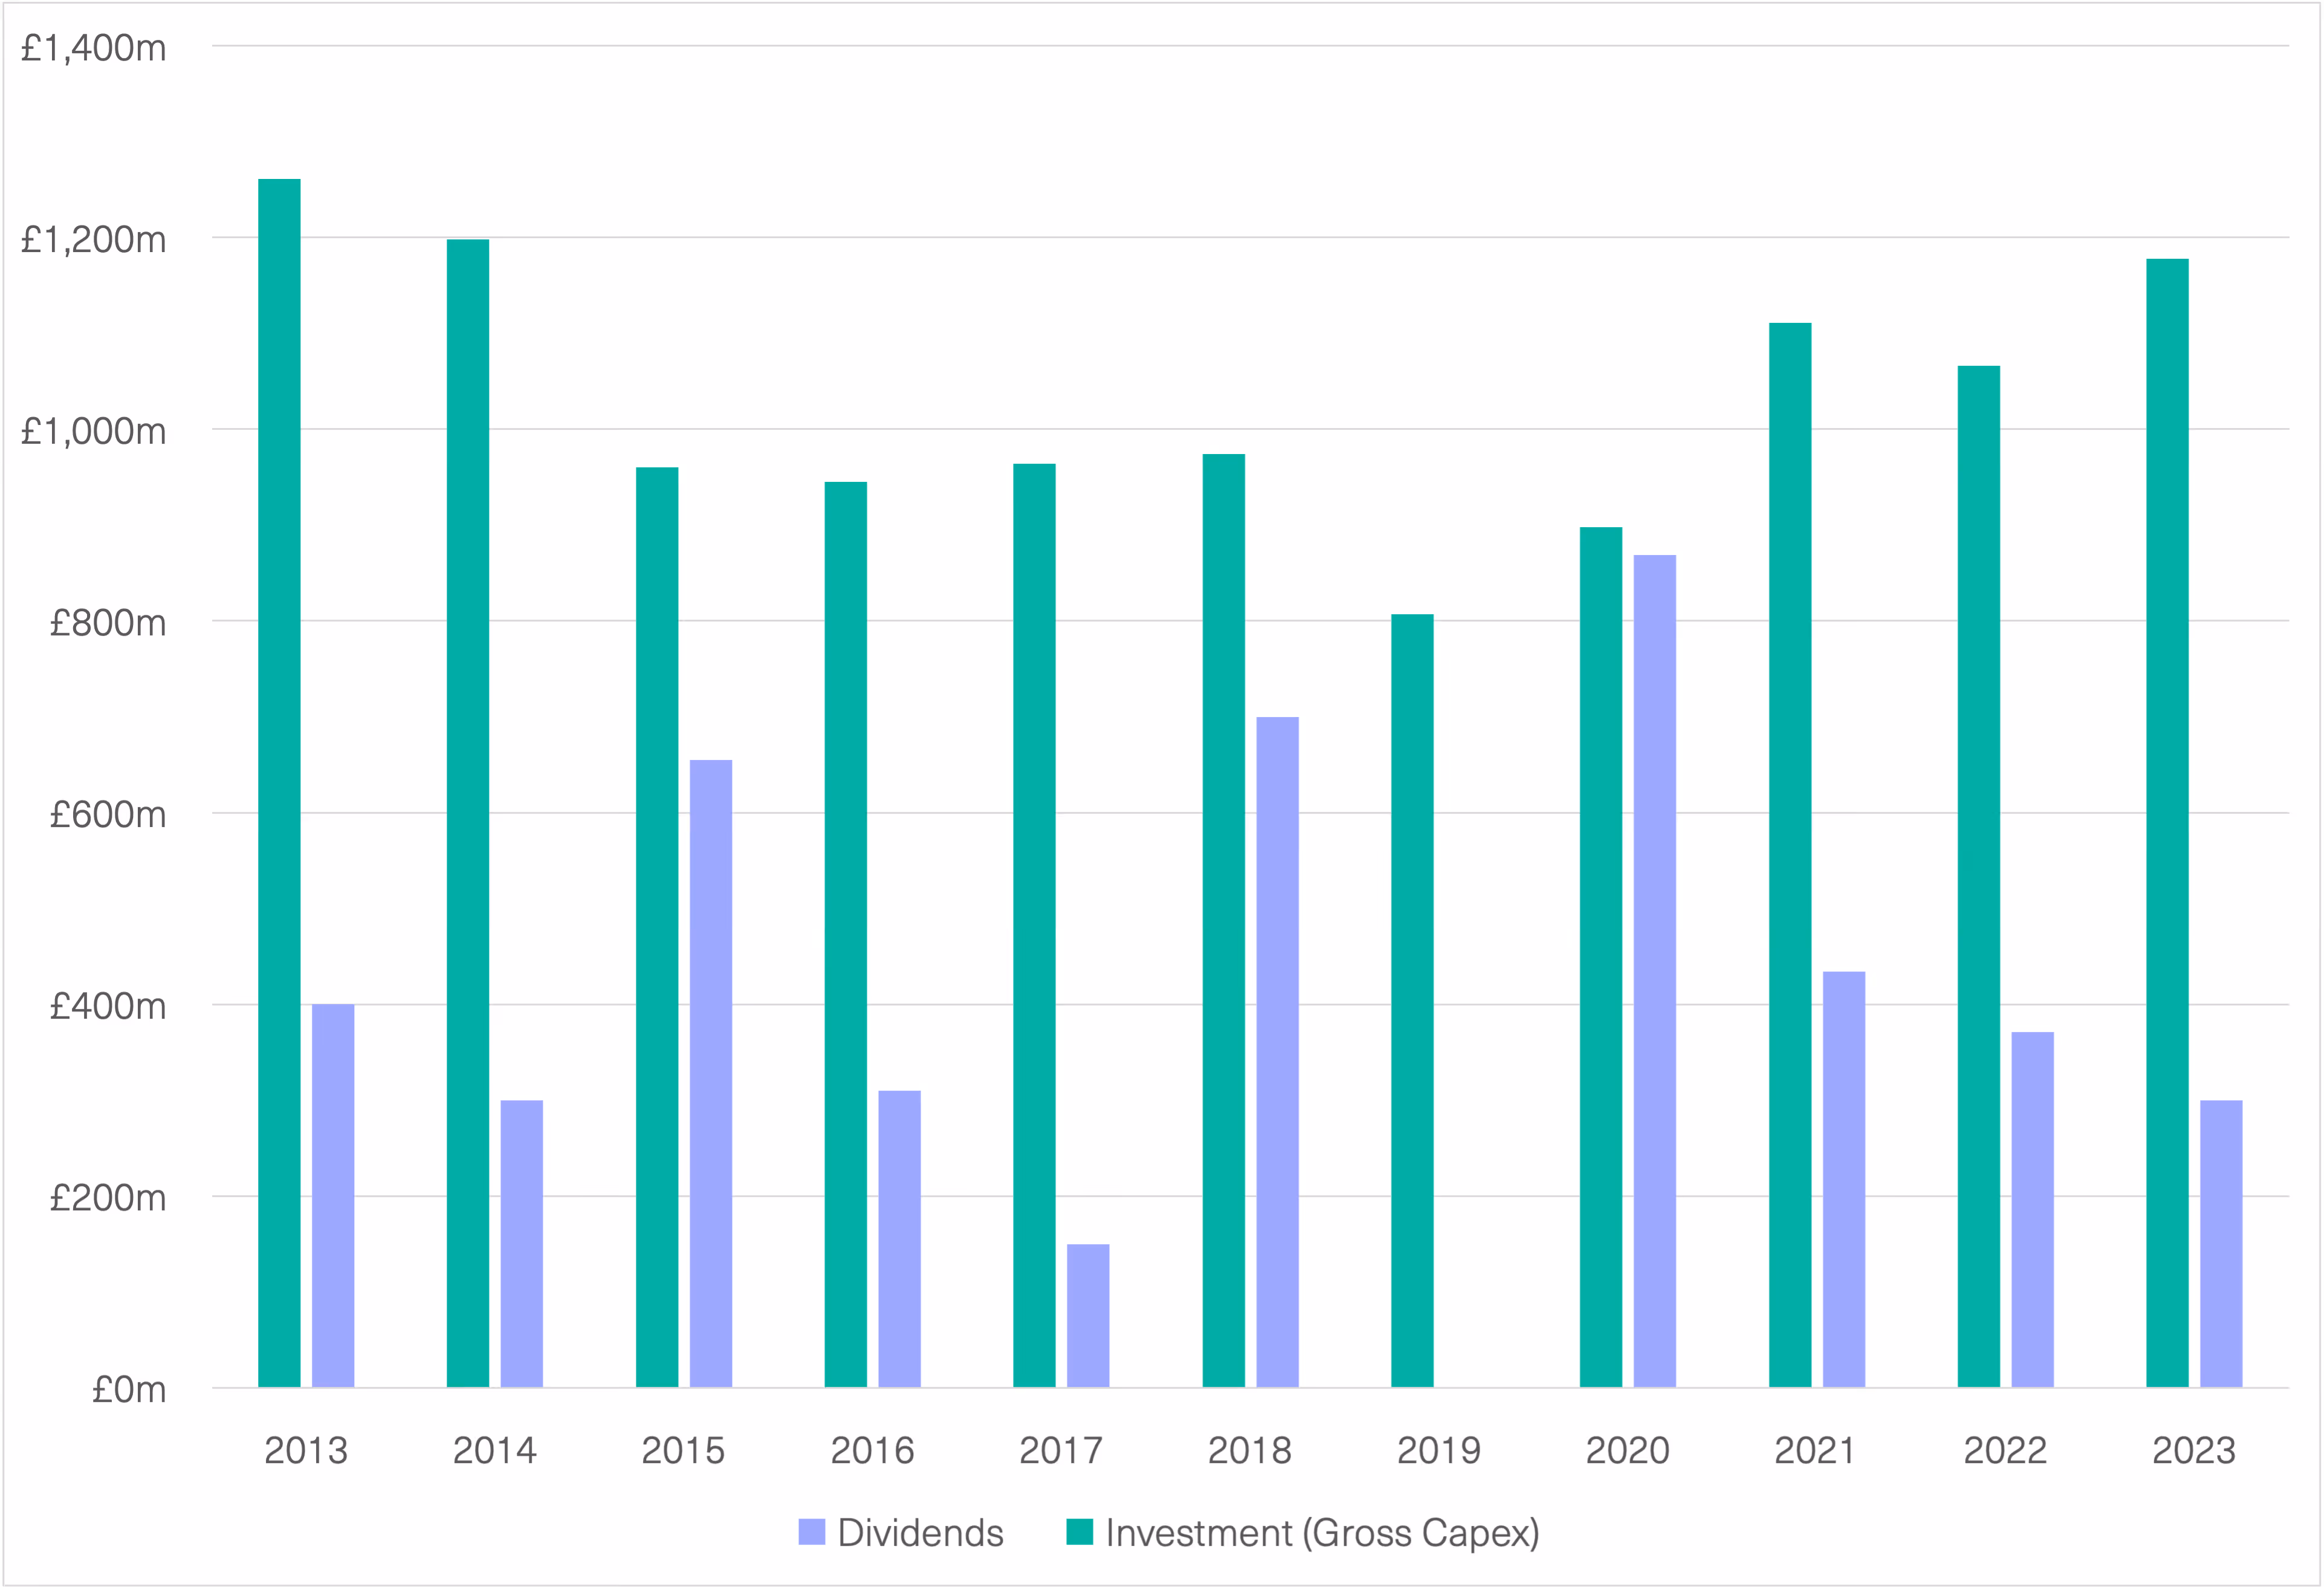
[.notes]Source: Common Wealth analysis of LSEG Refinitiv database and published company accounts.[.notes]
National Grid’s Electricity Transmission’s profit margins reached a peak in 2020 and have declined slightly through 2023. Given the exceptional nature of the years since 2020, which included the splitting off of National Grid ESO from the transmission business, the pandemic, and the crisis in global gas prices, it is indicative to note the general trend in the company’s electricity transmission segment between 2010-2019 was an operating profit margin close to 30% and a net profit margin between 15% and 20%.
[.fig]Figure 9: National Grid Electricity Transmission: Profit Margins[.fig]
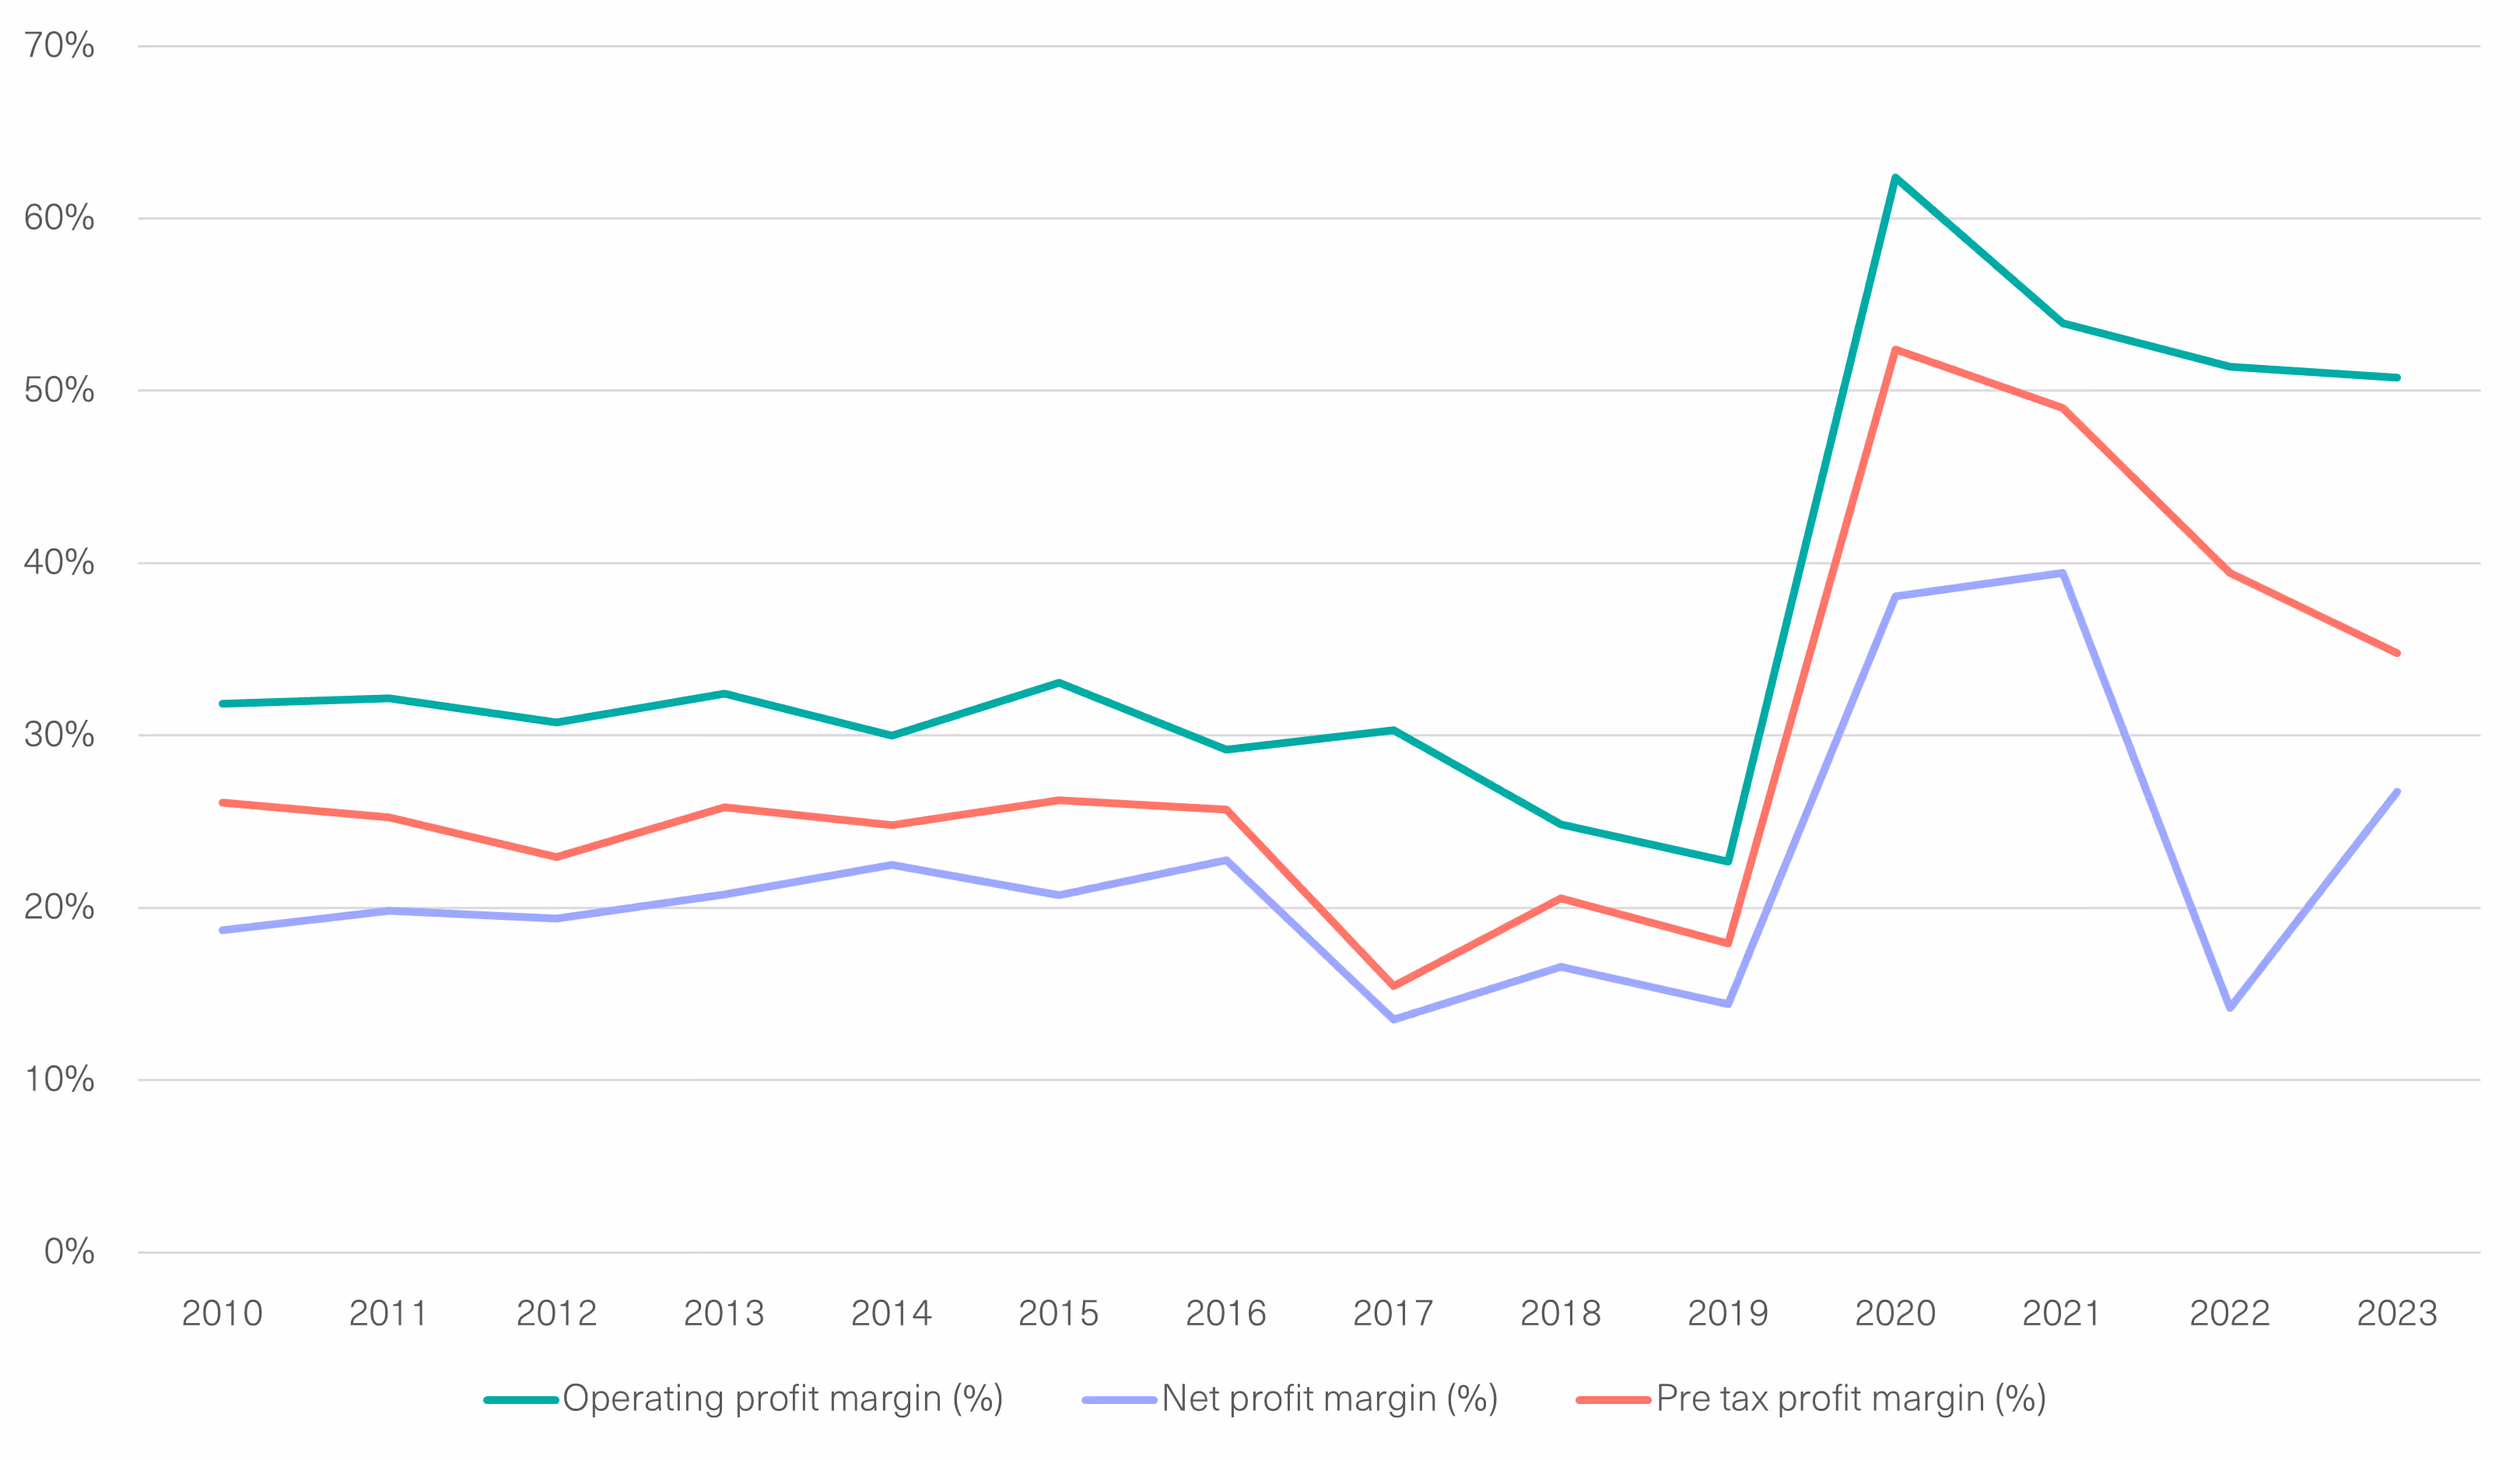
[.notes]Source: Common Wealth analysis of LSEG Refinitiv.[.notes]
These profit margins, measured relative to revenue, are distinct from the return on capital employed (ROCE) or “rate of return”, which is the Office for National Statistics’ (ONS) preferred profitability indicator. By measuring how efficiently investors’ capital is being employed to generate profits, ROCE is more comparable across industries of varying capital-intensity than margin-based metrics, and is thus preferred by investors as an indicator of where their capital can be most lucratively deployed.
Our concern, however, is with how effectively and efficiently the public is served by their transmission and distribution networks, not with how favourably these essential monopoly infrastructures compare with alternative portfolio allocation opportunities. It is one thing to claim that investors are being legitimately compensated for their risk, or for the opportunity cost of their investment. It is another to claim that that risk is remotely necessary in a world where ownership regimes are a policy choice and when the infrastructure concerned is as essential as the grid is to delivering a decarbonised, energy-secure and resilient economy.
With that in mind, we focus on profit margins — which already express capital-intensity via the depreciation expenditure line — as an indicator of how much of the firm’s flows of income and expenditure is being cashed out in the form of profit at the ultimate expense of customers: 50% before interest and 35% before tax. As already noted, 13% of revenues are paid out in dividends.
Notably, we are not alone in this position: in its 2019 State of the Energy Market Report (the most recent available), Ofgem admitted the “overall costs of the transmission and distribution networks to consumers … have turned out to be higher than they needed to be. In practice, the majority of network companies are achieving profit margins towards the higher end of our expectations for each sector.”[53]
Figures on National Grid’s ROCE along with accompanying commentary are provided in Appendix 2.
National Grid plc is a multi-national corporation with approximately 50% of its operations in the UK and 50% in the United States. As a publicly listed company, its shareholders are globally distributed, with top positions occupied by US asset management giants BlackRock (1), Capital Group (2) and Vanguard (3), the Abu Dhabi Investment Authority (4), and the Norwegian Government Pension Fund (7). The top five shareholders in the company, controlling nearly a quarter of all shares, are shown in the table below.
[.img-caption]Table 2: National Grid Top Five Shareholders[.img-caption]
Decarbonisation of the power sector is the lynchpin of the broader energy transition and a green industrial strategy for the UK: moving to clean power would not only curb emissions from current patterns of electricity use, it will also enable electrification of downstream production processes and, through cheaper power provision, support the development of a thriving green manufacturing sector and broader macroeconomic stability. This vital process depends on investment at unprecedented speed and scale to transform the transmission system — precisely the conditions in which a considerably lower cost of capital and strategic coordination and oversight make all the difference.
As the preceding sections have elaborated, the current grid infrastructure is worryingly off track after years of inadequate investment and planning, and now faces unprecedented need for investment and coordination in the increasingly rapid transition to a decarbonised electricity system and wider economy. Investment under the regulated monopoly system has failed to keep pace even with the demands of the current system, evidenced through the enormous costs associated with constraint, congestion and leakage. Already, a lack of proactive coordination of the grid has led to bottlenecks holding back renewable deployment, which will only worsen as we move to the investment sprint necessary to deliver power sector decarbonisation goals.
At the same time, National Grid (and, as explored below, the DNOs) has enjoyed consistently high profit margins, used to reward its international shareholders with billions in dividends alongside its executives, with the firm’s CEO enjoying a pay packet of over £7 million in 2022. To put that figure in context, it would take someone on the median British salary 243 years to earn the equivalent sum.
In response to these tremendous and mounting pressures, the government and Ofgem have already taken two major steps with respect to overhauling the UK’s approach to planning grid investment, the first being the ASTI framework and the second the decision to take the ESO into public ownership as the Future System Operator, with explicit top-down strategic and advisory functions. However, neither of these changes has sufficient powers to rectify the failures of the current system or to deliver the best deal for the public in building a decarbonised grid.
As it stands, available documents suggest the Future System Operator is envisioned in a purely advisory and consultatory role, collating and analysing data to provide advice to government and Ofgem on strategy and planning for decarbonising the grid. While the return of strategy and coordination functions to the public sector is both welcome and desperately needed, these changes would be more effective with the public given not just an advisory but a direct coordinating role through public ownership and operation of the grid. Added to the benefits of a planning function with teeth are the cost savings to be accrued via considerably reduced borrowing costs and the elimination of high profit margins and shareholder payouts. Further, relative to the balance sheet of a private multi-national company with multiple business segments, the public sector can bear substantially more risk with respect to an “all hands on deck” approach to grid investment and expansion.
As an indication of the potential savings from public ownership of the grid, we examine the cost savings from taking the UK electricity transmission business segment of National Grid (NGET) into public ownership. Following the approach of Hall and Weghmann,[54] who advocate paying the book value of equity — thereby compensating investors for the capital they have put into the company, rather than for the returns they expect based on private monopoly status as reflected in stock market value — we note that National Grid Electricity Transmission’s latest recorded equity book value, as of March 2023, was £4.45 billion. Borrowing to acquire this book value at 2.85% (the midpoint of Ofgem’s latest published estimate range for the risk-free rate)[55] would amount to £127 million per year in interest, saving £451 million per year relative to the dividend payments implied by the 13.0% return on equity that they averaged over the last ten years. This implies that the savings from eliminating dividends would alone pay for the £4.45 billion cost of acquisition in roughly ten years. Of course, this back-of-the-envelope calculation is based on the value of the current asset base and therefore does not cover the relative costs and savings from public ownership in the massive expansion of investment (and therefore of the asset base) demanded by the transition to net zero, it does provide an indication of the substantial potential savings to be derived from the lower cost of capital implied by public ownership.
[.box][.box-header]Box: International Comparisons of Grid Ownership[.box-header][.box-paragraph]It is worth noting that the UK is an outlier among peer countries in having a fully privatised grid. A selection of peer countries is presented here for the purposes of comparison.[.box-paragraph][.box-paragraph]Denmark: Energinet owns, operates and develops Denmark’s electricity and natural gas transmission systems. It is an independent public enterprise owned by the Danish Ministry of Climate, Energy and Utilities.[.box-paragraph][.box-paragraph]Canada: Ownership of the grid in Canada is devolved to the provincial level. Canada’s largest provinces with respect to population are, in descending order, Ontario, Quebec, and British Columbia, with 75% of the country’s total population residing in these three provinces. In Quebec, publicly owned utility Hydro-Quebec is responsible for transmission, distribution and generation of the province’s nearly 100% hydro power. In British Columbia, the publicly owned company BC Hydro owns and operates generation, storage, transmission and distribution for vast majority of province, with minor areas taken up by a small handful of regional entities. Finally, in Ontario, transmission is nearly 100% owned and operated by Hydro One, a formerly publicly owned and operated company which was very controversially privatised and floated on the stock market in 2015, though the provincial government retains just under 50% of shares. Critically, while this move was cited by the acting government as necessary for shoring up the province’s finances in a move echoing privatisation in the UK under the Thatcher government, Ontario’s Financial Accountability Office has subsequently confirmed that the sale has and will continue to cost the province billions through foregone revenues.[56][.box-paragraph][.box-paragraph]Sweden: Svenska Kraftnat is a state-owned enterprise and authority tasked with owning, operating and developing the national grid. The public company Vattenfall is responsible for distribution, with the Distribution Operators legally unbundled from the firm’s other operations.[.box-paragraph][.box-paragraph]Germany: In Germany the high voltage transmission grid is largely owned by the four transmission system operators (TSOs): TenneT, 50Hertz Transmission, Amprion and TransnetBW. These were privatised under Merkel, a decision the government is now reportedly planning to at least partially reverse: as of March, reports surfaced that the German government was in talks to merge all four into a public company “German Grid Corporation”.[57][.box-paragraph][.box-paragraph]France: Distribution networks in France are owned by local authorities, who subcontract the work of distribution to Enedis, which is ultimately a subsidiary of state-owned EDF. Transmission is owned and managed by RTE, jointly owned by EDF and the country’s public bank, Caisse des Depots.[.box-paragraph][.box]
Advocates of private ownership and investment in the energy system regularly cite the benefits of competition in delivering innovation, efficiency and reduced costs for users. However, the ownership and operation of the grid is by definition incompatible with a competitive market. Where competition does exist — for instance, in the competitive in tendering of new project construction — public ownership is entirely compatible with encouraging such competition and taking advantage of its potential benefits. It adds to these cost savings those from eliminating the imperative to maximise profits and shareholder distributions.
Finally, opponents of public ownership frequently cite the necessity of the shareholder payouts we criticise above as essential for the stability of private pensions, which invest in financial assets such as publicly listed companies. However, this argument rests on a considerable distortion of reality. Common Wealth estimates that all UK pensions combined own just 6% of shares in National Grid plc (1.8% directly, with the remaining ~4.2% held indirectly through intermediaries like mutual funds), and have an average portfolio exposure of just ~0.23% to shares in National Grid.[58] Thus, while the dividend payouts of National Grid are not particularly material to any given pension fund, let alone its individual beneficiaries, the negative impacts of the prevailing monopoly system on those beneficiaries are potentially enormous, both with respect to higher bills than necessary and, crucially, the costs of inadequate investment in the urgent task of decarbonisation.
As noted above, modelling by the Department for Energy Security and Net Zero (formerly BEIS) shows “network costs” will cumulatively total £300-£350 billion by 2050. Of this total figure, between £40 billion and £110 billion specifically attributed to the costs that companies “will be allowed to recover by 2050 to fund the required network investment to reach net zero”.[59] Importantly, these estimated costs are based in part on expectations of companies’ need to generate sufficient returns to cover their cost of capital, which is considerably inflated relative to the public as a result of higher average borrowing costs and the imperative to remunerate shareholders through billions in dividends.
As an indicative calculation of the scale of potential savings from public ownership: over the period from 2015 to present, the yields on ten-year bonds issued by entities related to both the National Grid and the DNOs have carried an average spread of 1.94 percentage points over equivalent UK gilts issued at the same time. If this spread were eliminated, based on the projected £40 to £110 billion in the debt-financed network investment required by the transition, public ownership could lead to savings of £776 million to £2.13 billion per year. If we assume an average debt maturity of ten years, then these savings would total a cumulative £7.76 to £21.3 billion. Details of this calculation can be found in Appendix 4.
Thus, under the status quo, not only will the public ultimately pick up the tab for investment in the grid through their bills, but that tab will be far higher than it needs to be, with the public shouldering the burden of rewarding wealthy shareholders and of the ongoing costs of a track record of inadequate investment. Ultimately, because we all require electricity to survive and participate in society, there is no escaping the fact that, one way or another, we will all pay for the grid, both its day-to-day operations and its long-term investment. The choice that we have is in what form we pay, and how those costs are distributed among the population, whether through bills or, for instance, progressive taxation.
To continue with the status quo implies an increasingly byzantine set of regulatory prods and mechanisms to force the hand of private companies to deliver adequate investment. With clear — albeit not always explicit — recognition from government and Ofgem of the need for public sector coordination of grid decarbonisation, a considerably more coherent, streamlined, effective and low cost approach to this urgent and complex challenge is to embrace the unique powers of the public sector, notably its risk-bearing capacity, unique capacity for system-wide planning and coordination, lower borrowing costs and freedom from the imperative to reward private shareholders, to rapidly and justly deliver a decarbonised grid as the backbone of a net zero UK.
According to National Grid, while charges for use of their long-range transmission infrastructure constitute approximately 3% of an average household bill, “other networks” — that is, the DNOs — account for closer to 20%.[60] Thus, where National Grid’s financial accounts are sufficient to raise the question of public ownership and governance, the DNOs set a new standard. According to financial data provider IBISWorld, in 2030 the DNOs had the fourth highest profit margins of any UK sector at 42.5%, with a range of financial services sectors currently occupying the top three spots.[61] Importantly, these exceptional margins are not a fluke event; they have been consistent over much of the past decade. Last year Common Wealth research found the DNOs enjoyed the highest profit margins of any sector of the UK economy in 2021, at 42.5%.[62] Moreover, a 2017 report by the Energy and Climate Intelligence Unit concluded that from 2010-2015, the average profit margin posted by the DNOs was “huge by any standard” at 32%, adding a total of £10 billion to the national energy bill over the same period.[63]
Figure 10, below, shows in the capital payments (interest on debts and shareholder payouts) of the parent companies of the DNOs as a percentage of both revenues and investment (gross capital expenditure). Notably, according to reporting by the Financial Times, UK Power Networks, which services the London, the Southeast and East Anglia and is owned by Hong Kong billionaire Li Ka-Shing through CK Infrastructure Holdings, “paid a £217 million dividend to its owner in the year to 2022”, having posted a pre-tax profit of over £530 million.[64]
[.fig]Figure 10: Distribution Company Parent Capital Payments, 2014-2023[.fig]
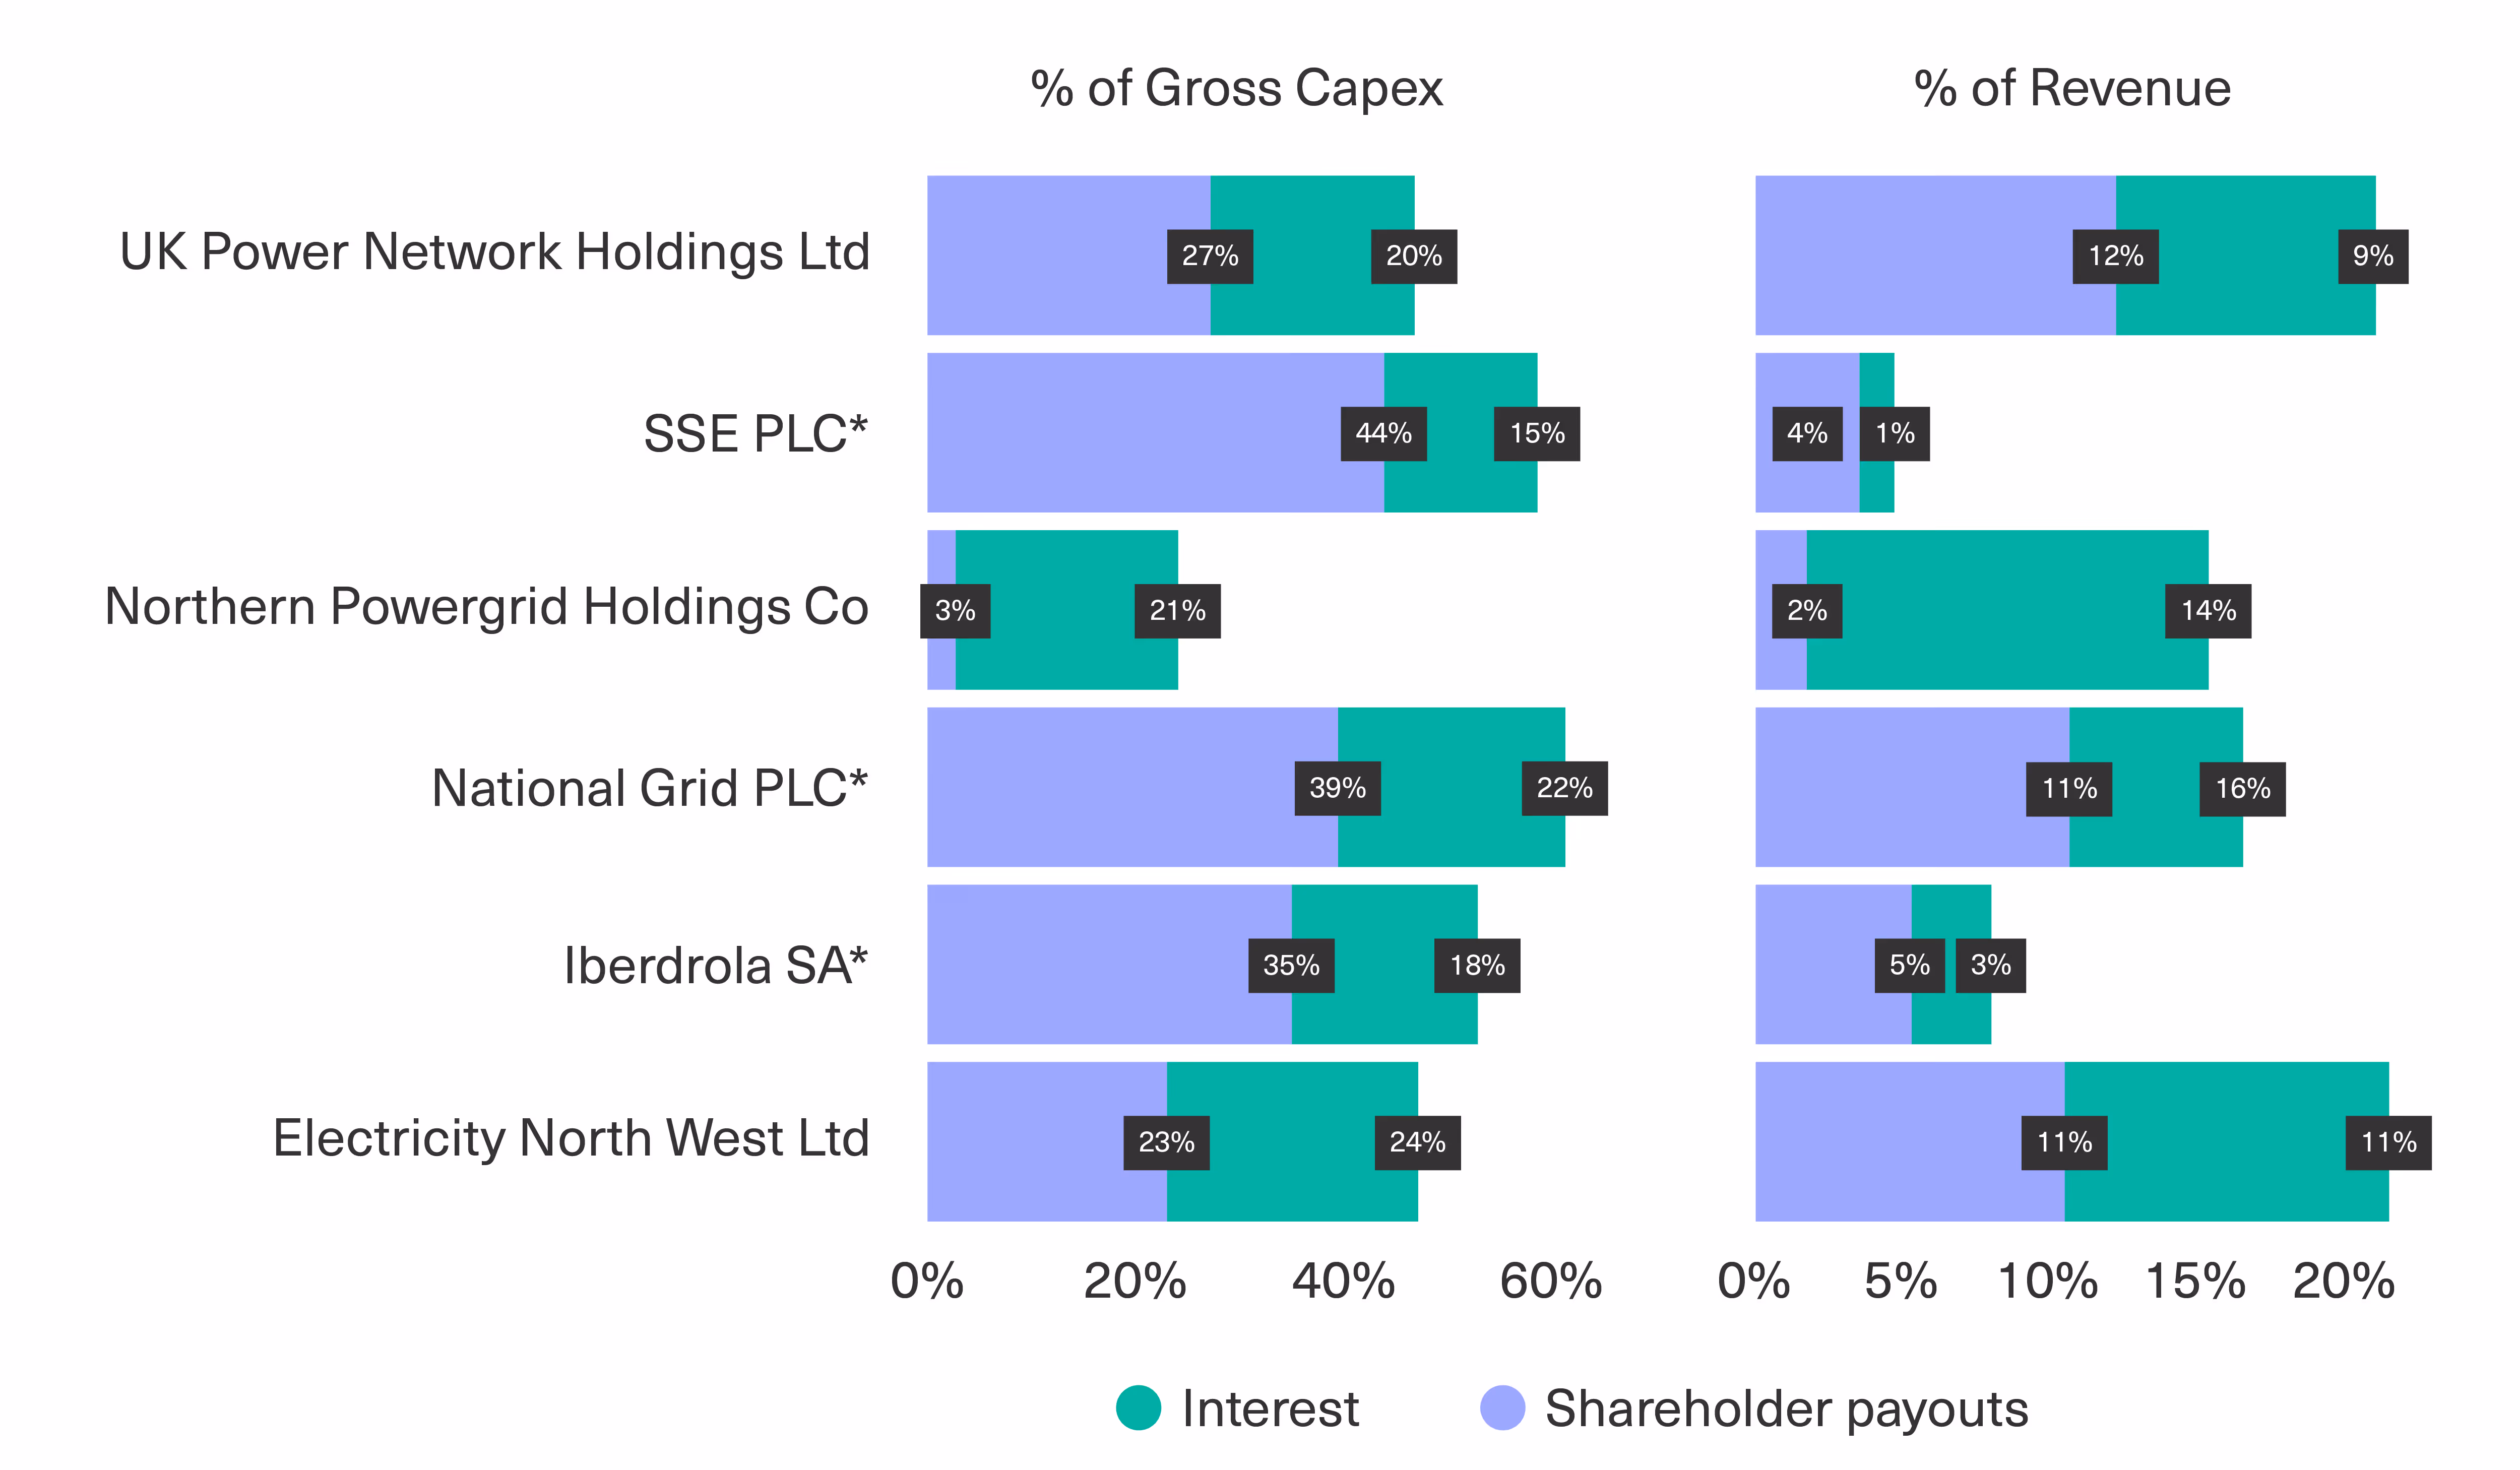
[.notes]Note: Figures show aggregated annual interest payments, dividends and net share buyback/issuance from cash flow statements. SSE and Iberdrola are the immediate parents of Scottish Hydro and Scottish Power respectively. For full detail see Appendix I. Source: Common Wealth analysis of LSEG Refinitiv.[.notes]
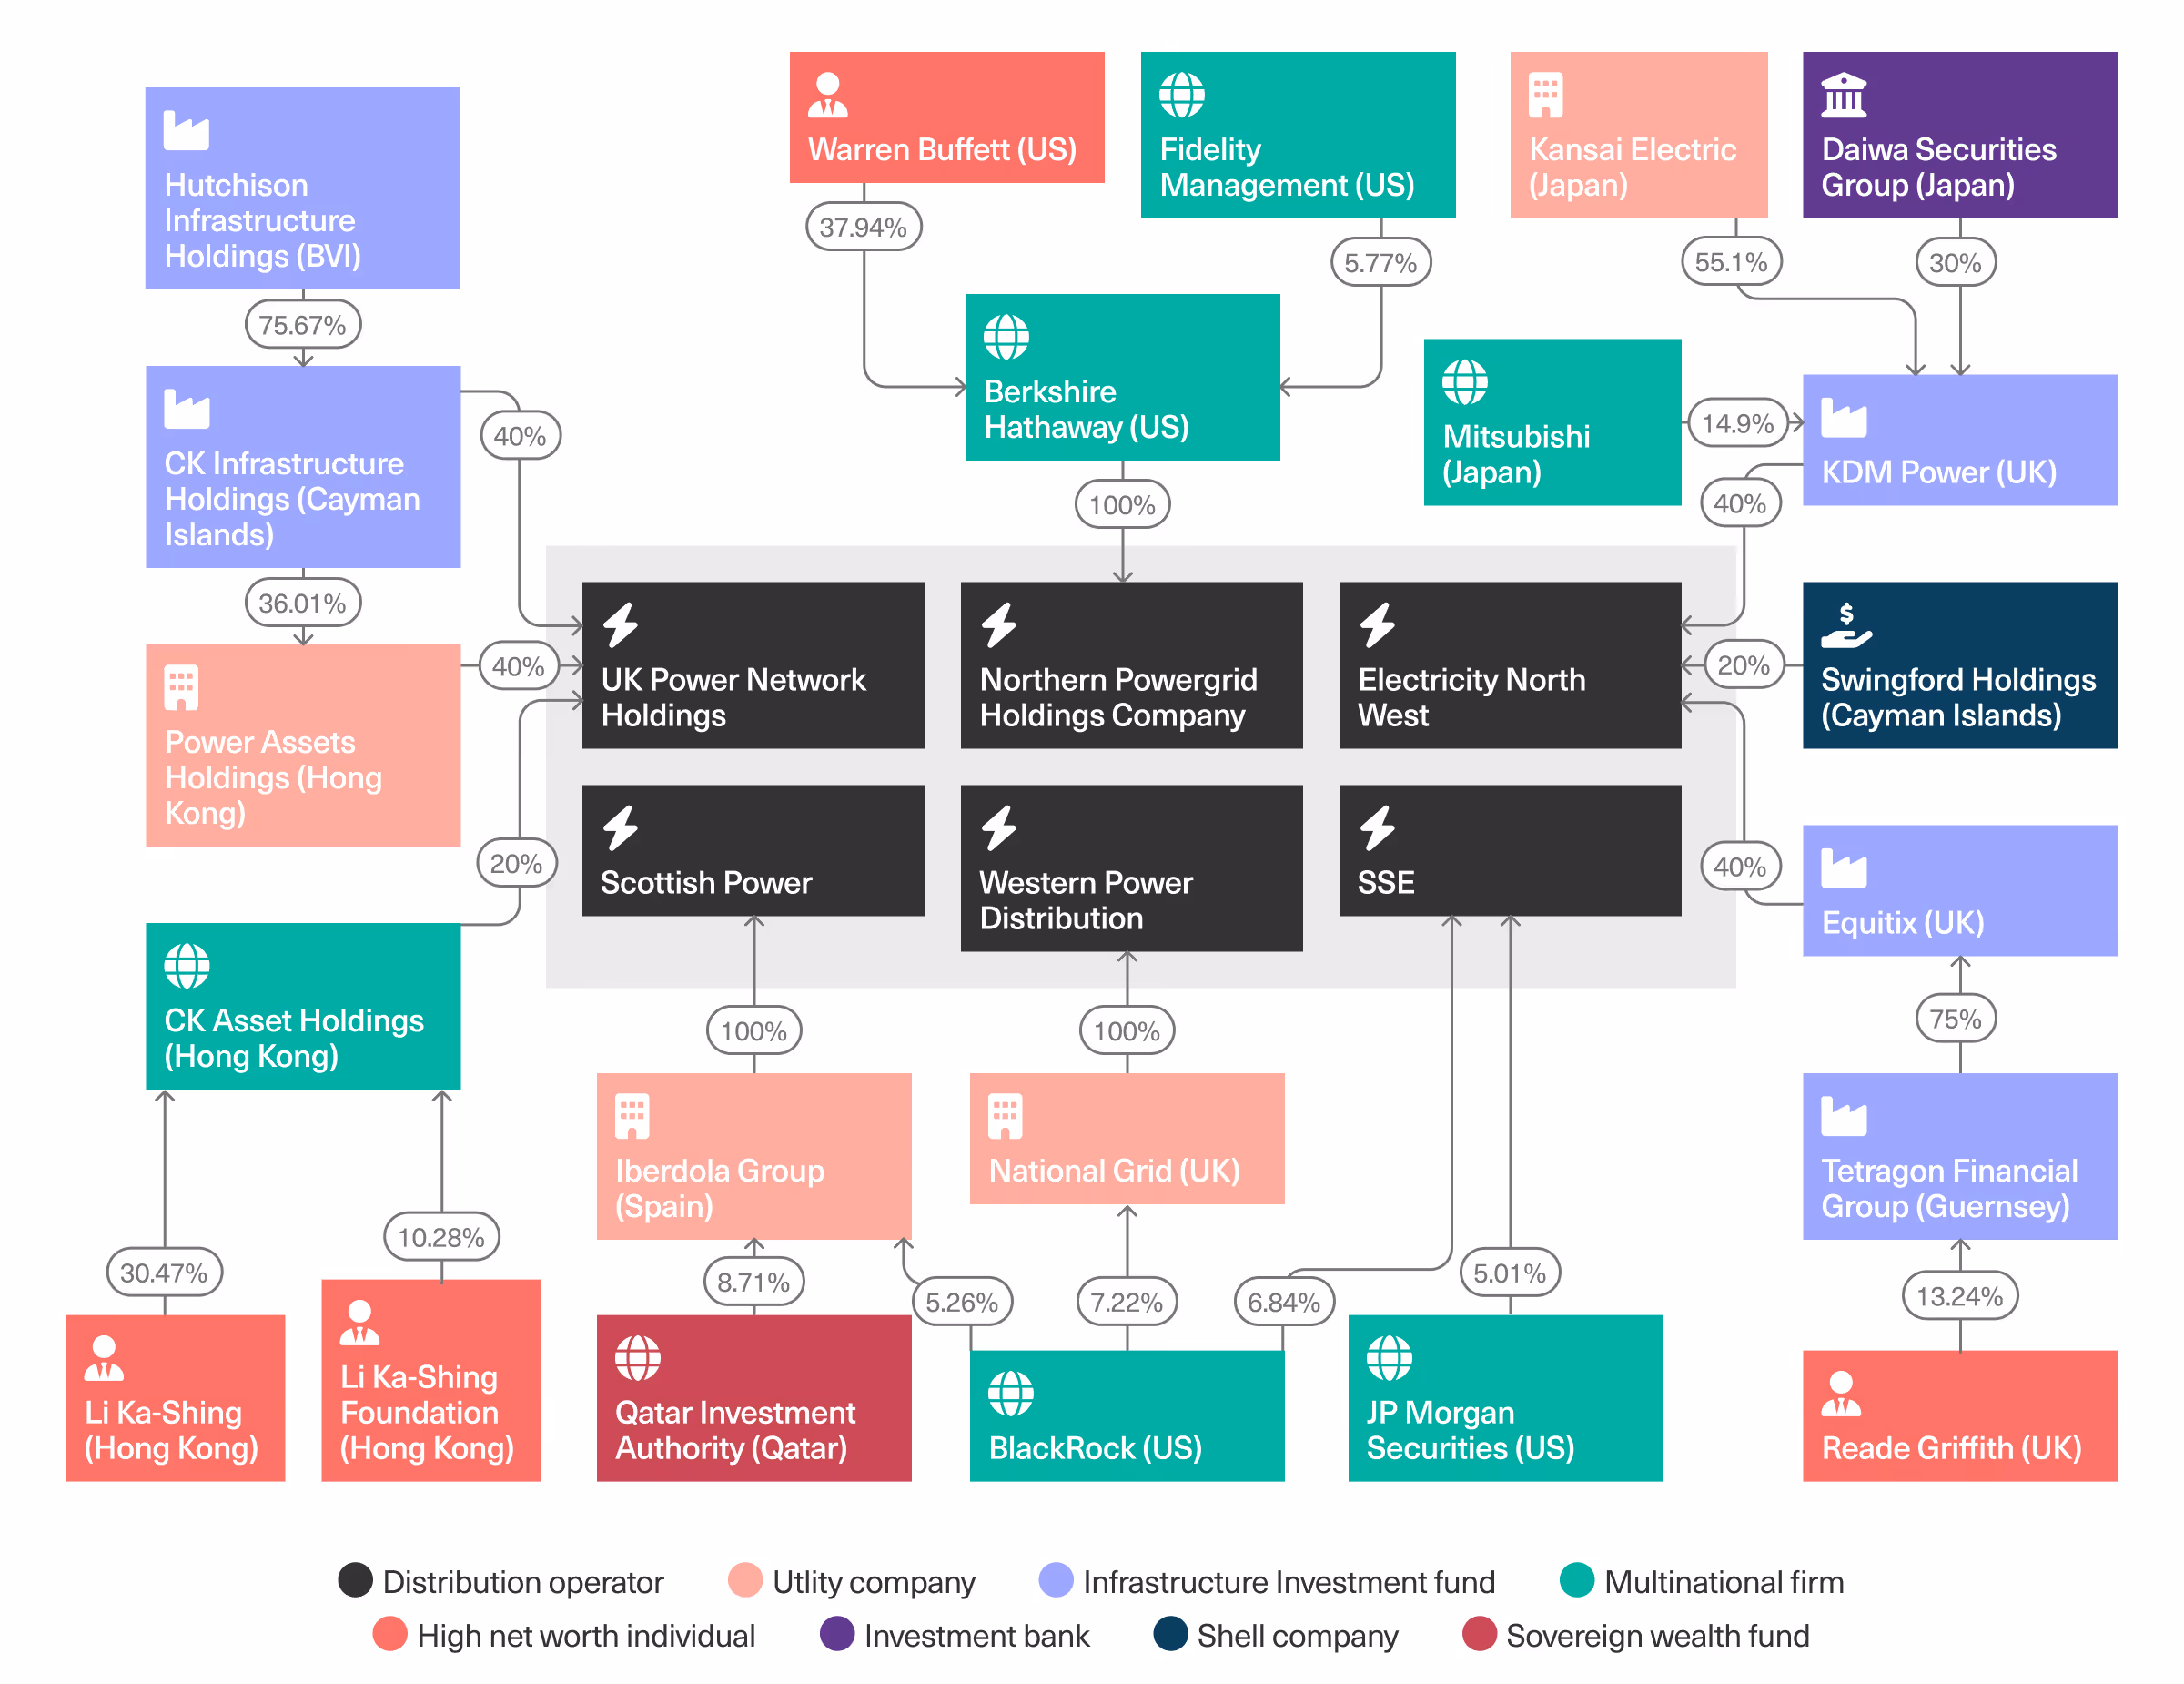
It is worth noting that while National Grid is a publicly traded company, the ultimate ownership of the DNOs is considerably more convoluted, with holding companies registered in tax havens and billionaires including Warren Buffett and Li Ka-Shing among the major owners (see Figure 11, below).
[.fig]Figure 11: Ultimate Ownership of Distribution Network Operators[.fig]
Importantly, as noted above, while operating profit margins are only one measure of profitability, and do not, for instance, reflect capital employed, the essential concern in a vital industry like household energy provision should be universal affordable access, and these exceptional margins suggest a considerable portion of income and expenditure flows are being cashed out as profits (for further explanation, see National Grid Financial Accounts and Summary and Appendix 2. As distribution networks become increasingly vital to a stable decarbonised grid — for instance through connections to distributed storage — the need for investment and the outsized profits and payouts of these firms raise clear doubts over how the delivery of a vital service we all need to survive and thrive by private, for-profit monopolies, can continue to be justified.
The figure below shows the rate of return for National Grid’s different business segments, used by the ONS to measure profitability across the economy and calculated here using the ONS methodology. As the figure shows, National Grid’s electricity segment has delivered a rate of return marginally lower than the national average over the past few years, having been broadly similar for the preceding decade. Their gas segment, by contrast, has delivered a consistently lower rate of return.
[.fig]Figure A1: National Grid Return on Capital Employed by Business Segment[.fig]
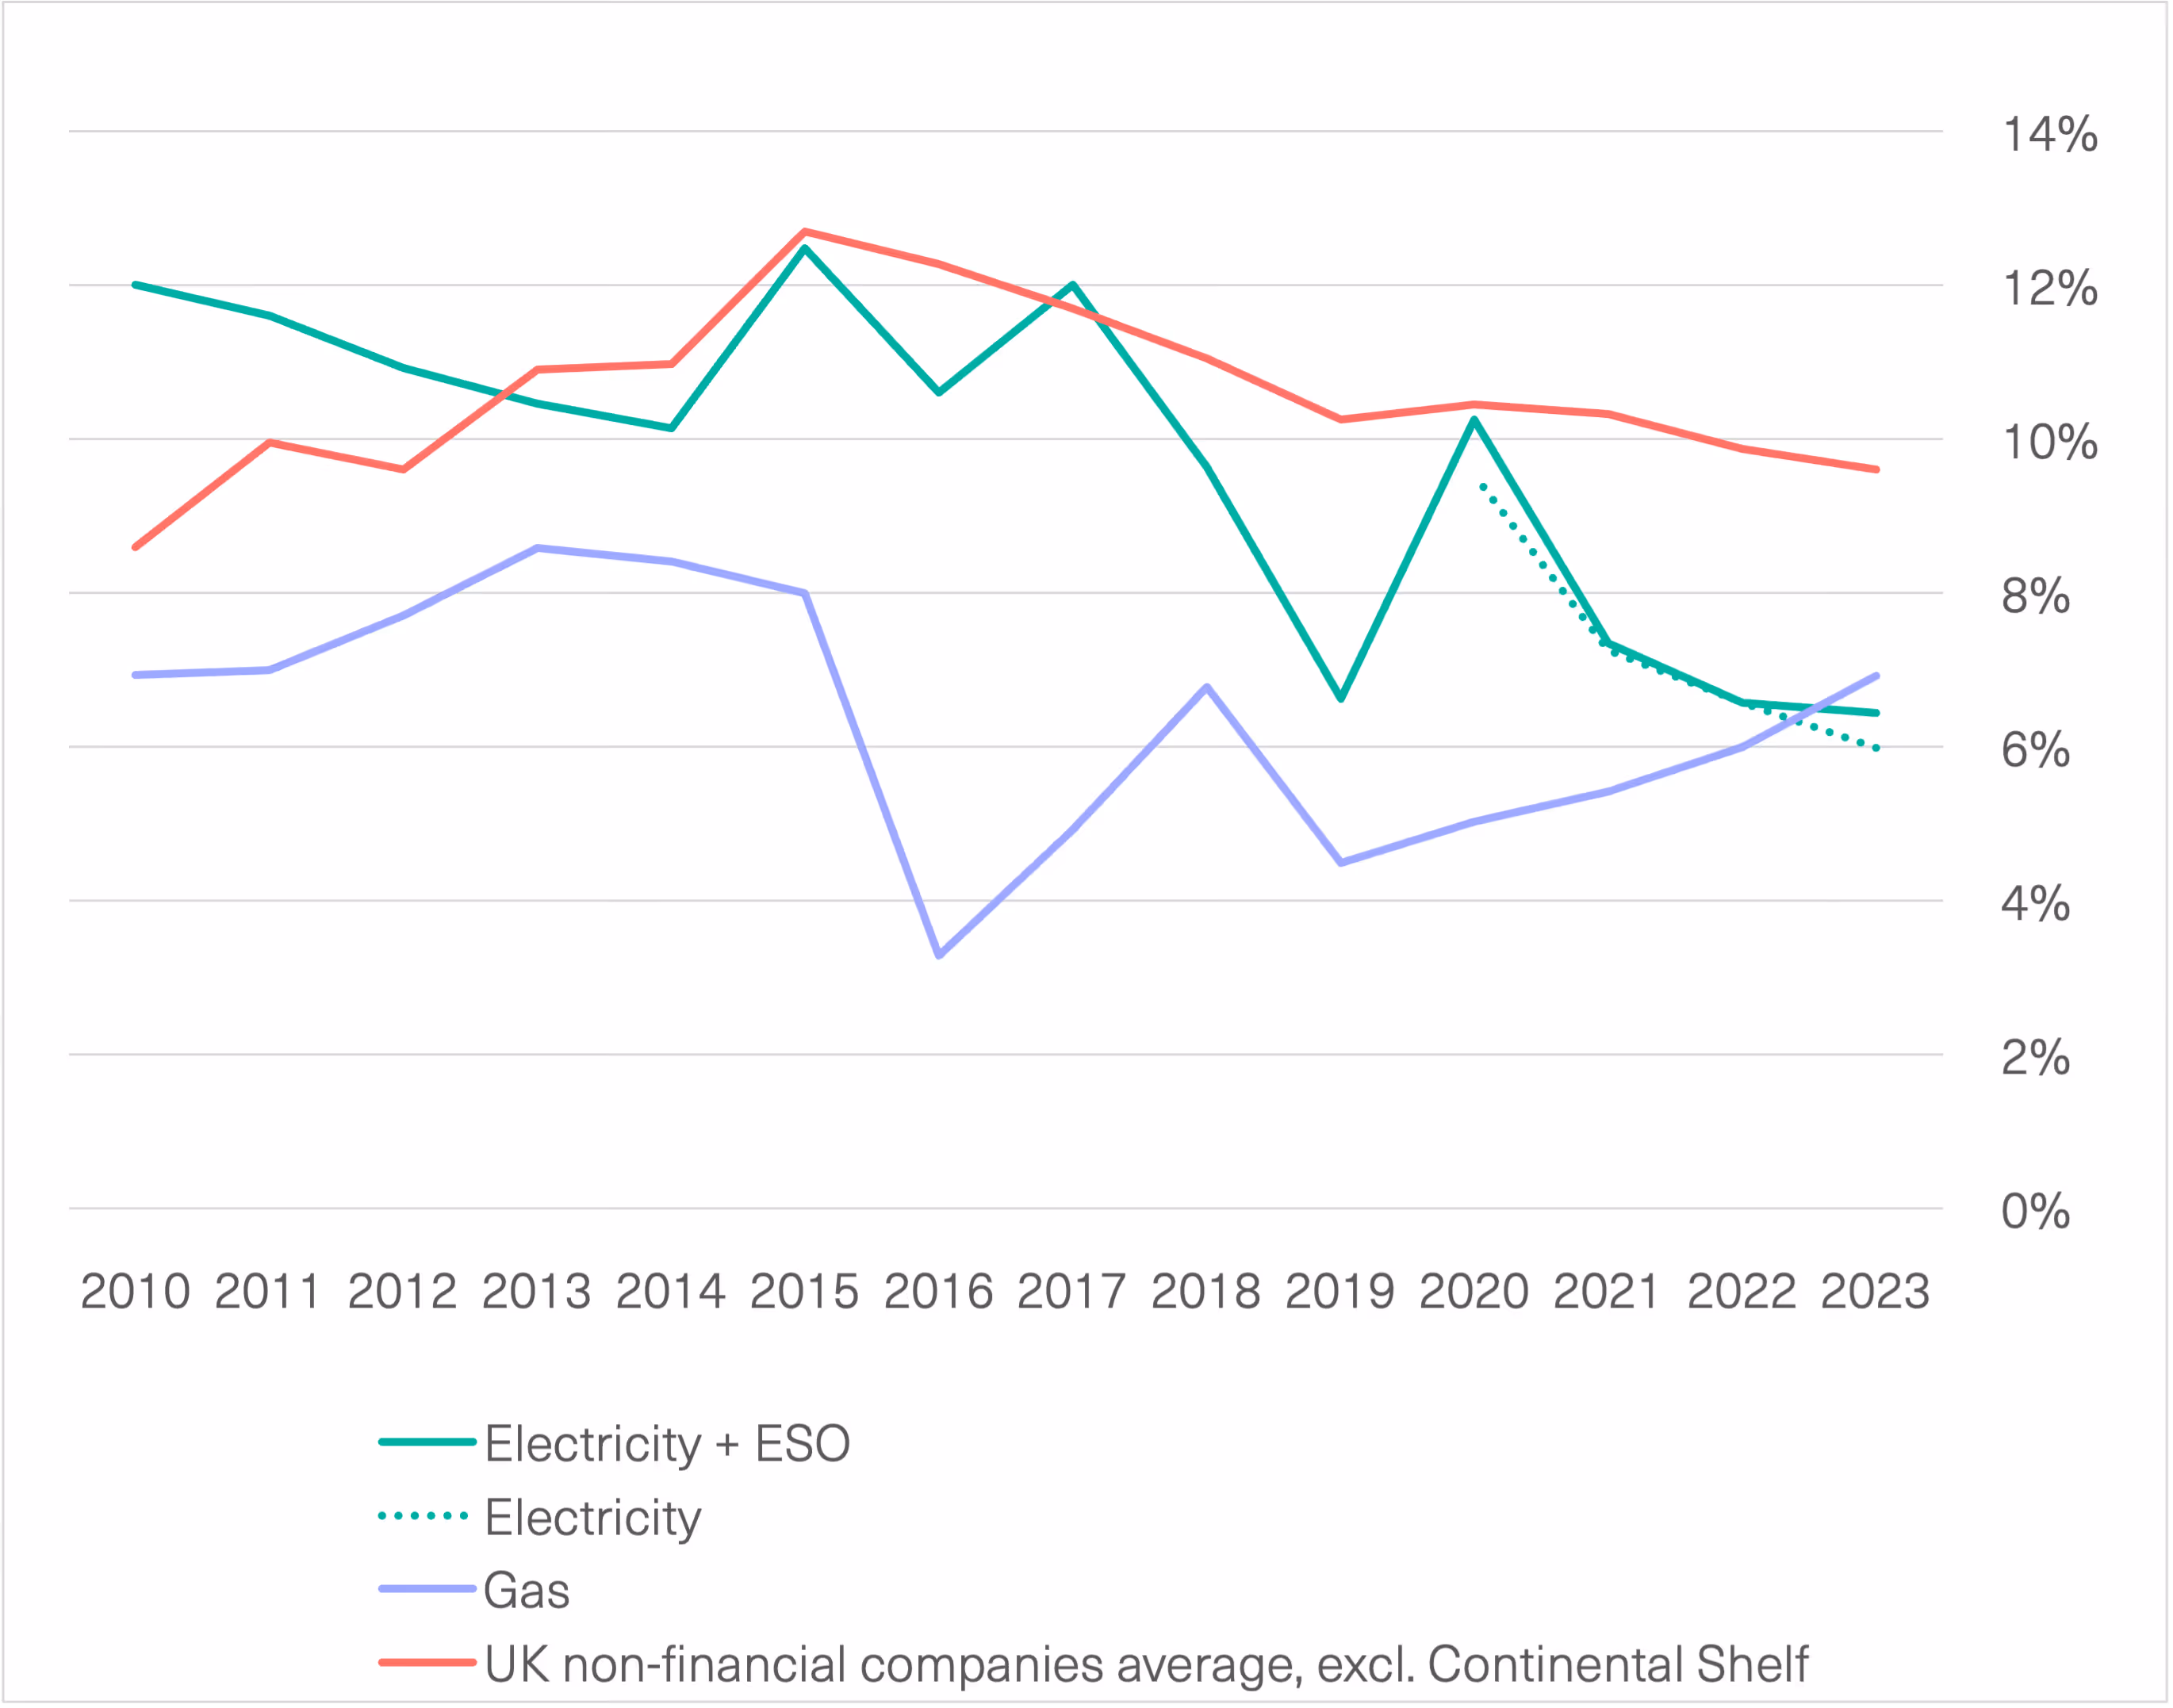
[.notes]Source: Common Wealth analysis of LSEG Refinitiv and published accounts.[.notes]
Return on capital employed (ROCE is often used by financial analysts to compare the profitability of firms in capital-intensive industries, as it indicates how efficiently capital is being employed to generate profits. What it primarily tells us, therefore, is how lucrative it is likely to be for investors to park their capital (debt or equity) in a given company relative to alternatives. In contrast to the concerns of prospective investors, the most relevant questions pertaining to an infrastructure as vital to participation in daily life and to building a decarbonised economy as the grid should be the balance of affordability for users and the security and sustainability of energy provision. Thus, in contrast with ROCE, we are interested in how much of the revenue generated by British energy users is actually required to carry out the functions of National Grid’s electricity business.
The cost of physical capital is reflected in National Grid’s income statement as depreciation on an accruals basis, mean its overall cost is spread out over its useful economic life. Doing so depresses the firm’s EBIT — that is, the numerator of the ROCE calculation — via operating expenditure. The National Grid’s capital intensity therefore affects its ROCE both through its denominator and — in a more fictitious, paper form — through the numerator. Comparability with other industries’ operating margins and ROCE is therefore heavily affected by the depreciation policy used in its accounts.
To take the case of National Grid Electricity Transmission: a 6.0% ROCE (as in 2023) implies the company’s capital employed is equivalent to 15 years of EBIT, on an undiscounted basis. The 10-12% ROCE over the course of 2010-17 would imply only eight to ten (undiscounted). By contrast, the stated depreciation policy for Electricity Transmission plant assumes a useful economic life of 15-100 years, and — if we assume a straight-line policy with a scrap value of zero — the relative size of their depreciation and amortisation expense implies an average life of 31 years. We note that their EBITDA for the year 2021/22 was equivalent to 9.8% of capital employed, having hovered in the 14-16% region throughout 2010-18.
At any rate, in the case of National Grid Electricity Transmission’s, an operating margin of 50% before interest and a pre-tax margin of 35% (after interest) suggests that a considerable proportion of the flows of income and expenditure are being cashed out in the form of profits.
As an initial ‘back of the envelope calculation’ for how the savings generated by public ownership could contribute to paying for the one-off cost of asset acquisition, we calculate the savings from the elimination of dividends alone achievable by nationalisation. Based on acquisition of National Grid’s UK electricity transmission business at book value via compulsory purchase order, we employ the following formula, based on Hall and Weghmann’s[65] approach. Hall and Weghmann argue that any basis for shareholder compensation should not include excess monopoly profits; earnings dependent on regulatory regimes; value derived from a public service system; or risks or ’hope value’. Instead, shareholder compensation should be more analogous to a refund, following the principles underlying the post-WWII nationalisations.
We use the following calculation:
𝑠𝑎𝑣𝑖𝑛𝑔𝑠=𝐵𝑉×(𝑅𝑜𝐸−𝑟)
Where 𝐵𝑉 denotes the book value of equity, 𝑅𝑜𝐸 denotes return on equity — calculated as dividends over book value of equity — and 𝑟 denotes the risk-free rate at which the state is issuing the debt to finance the acquisition.
We use National Grid Electricity Transmission PLC’s average return on equity over the last ten years, of 13.0%.
Following Hall and Weghmann we use Ofgem’s latest available estimate of the risk-free rate. Ofgem specify lower and upper bounds of 2.4% and 3.3% respectively, “based on spot, 20-day average and 1-year average yields on the 5-year UK Gilt… using a reference date of 31 January 2023.”[66]
Our estimated bond spread of 1.94 percentage points is an unweighted average of the spreads of all 10-year bonds issued since 2015 by entities related to National Grid and other DNOs, relative to conventional 10-year UK Treasury gilts issued contemporaneously. Corporate bond issuances are sourced from LSEG Refinitiv Eikon, whereas gilt issuances are sourced from the Debt Management Office (DMO).
These spreads are depicted over time in Figure A2. The sharp temporary spike in gilt yields in the aftermath of the Truss Government’s infamous September 2022 ‘mini- budget’ is visible in negative spreads around that time. We exclude bonds for which data on yield upon issuance was unavailable, or for which contemporaneous 10-year gilts could not be found. Because our dataset includes issuances by related entities, many of the spreads colour-coded as, for example, Northern Powergrid relate to bonds issued by its parent firm Berkshire Hathaway.
[.fig]Figure A2: Borrowing costs for National Grid and the DNOs are 2ppt higher than for the UK state[.fig]
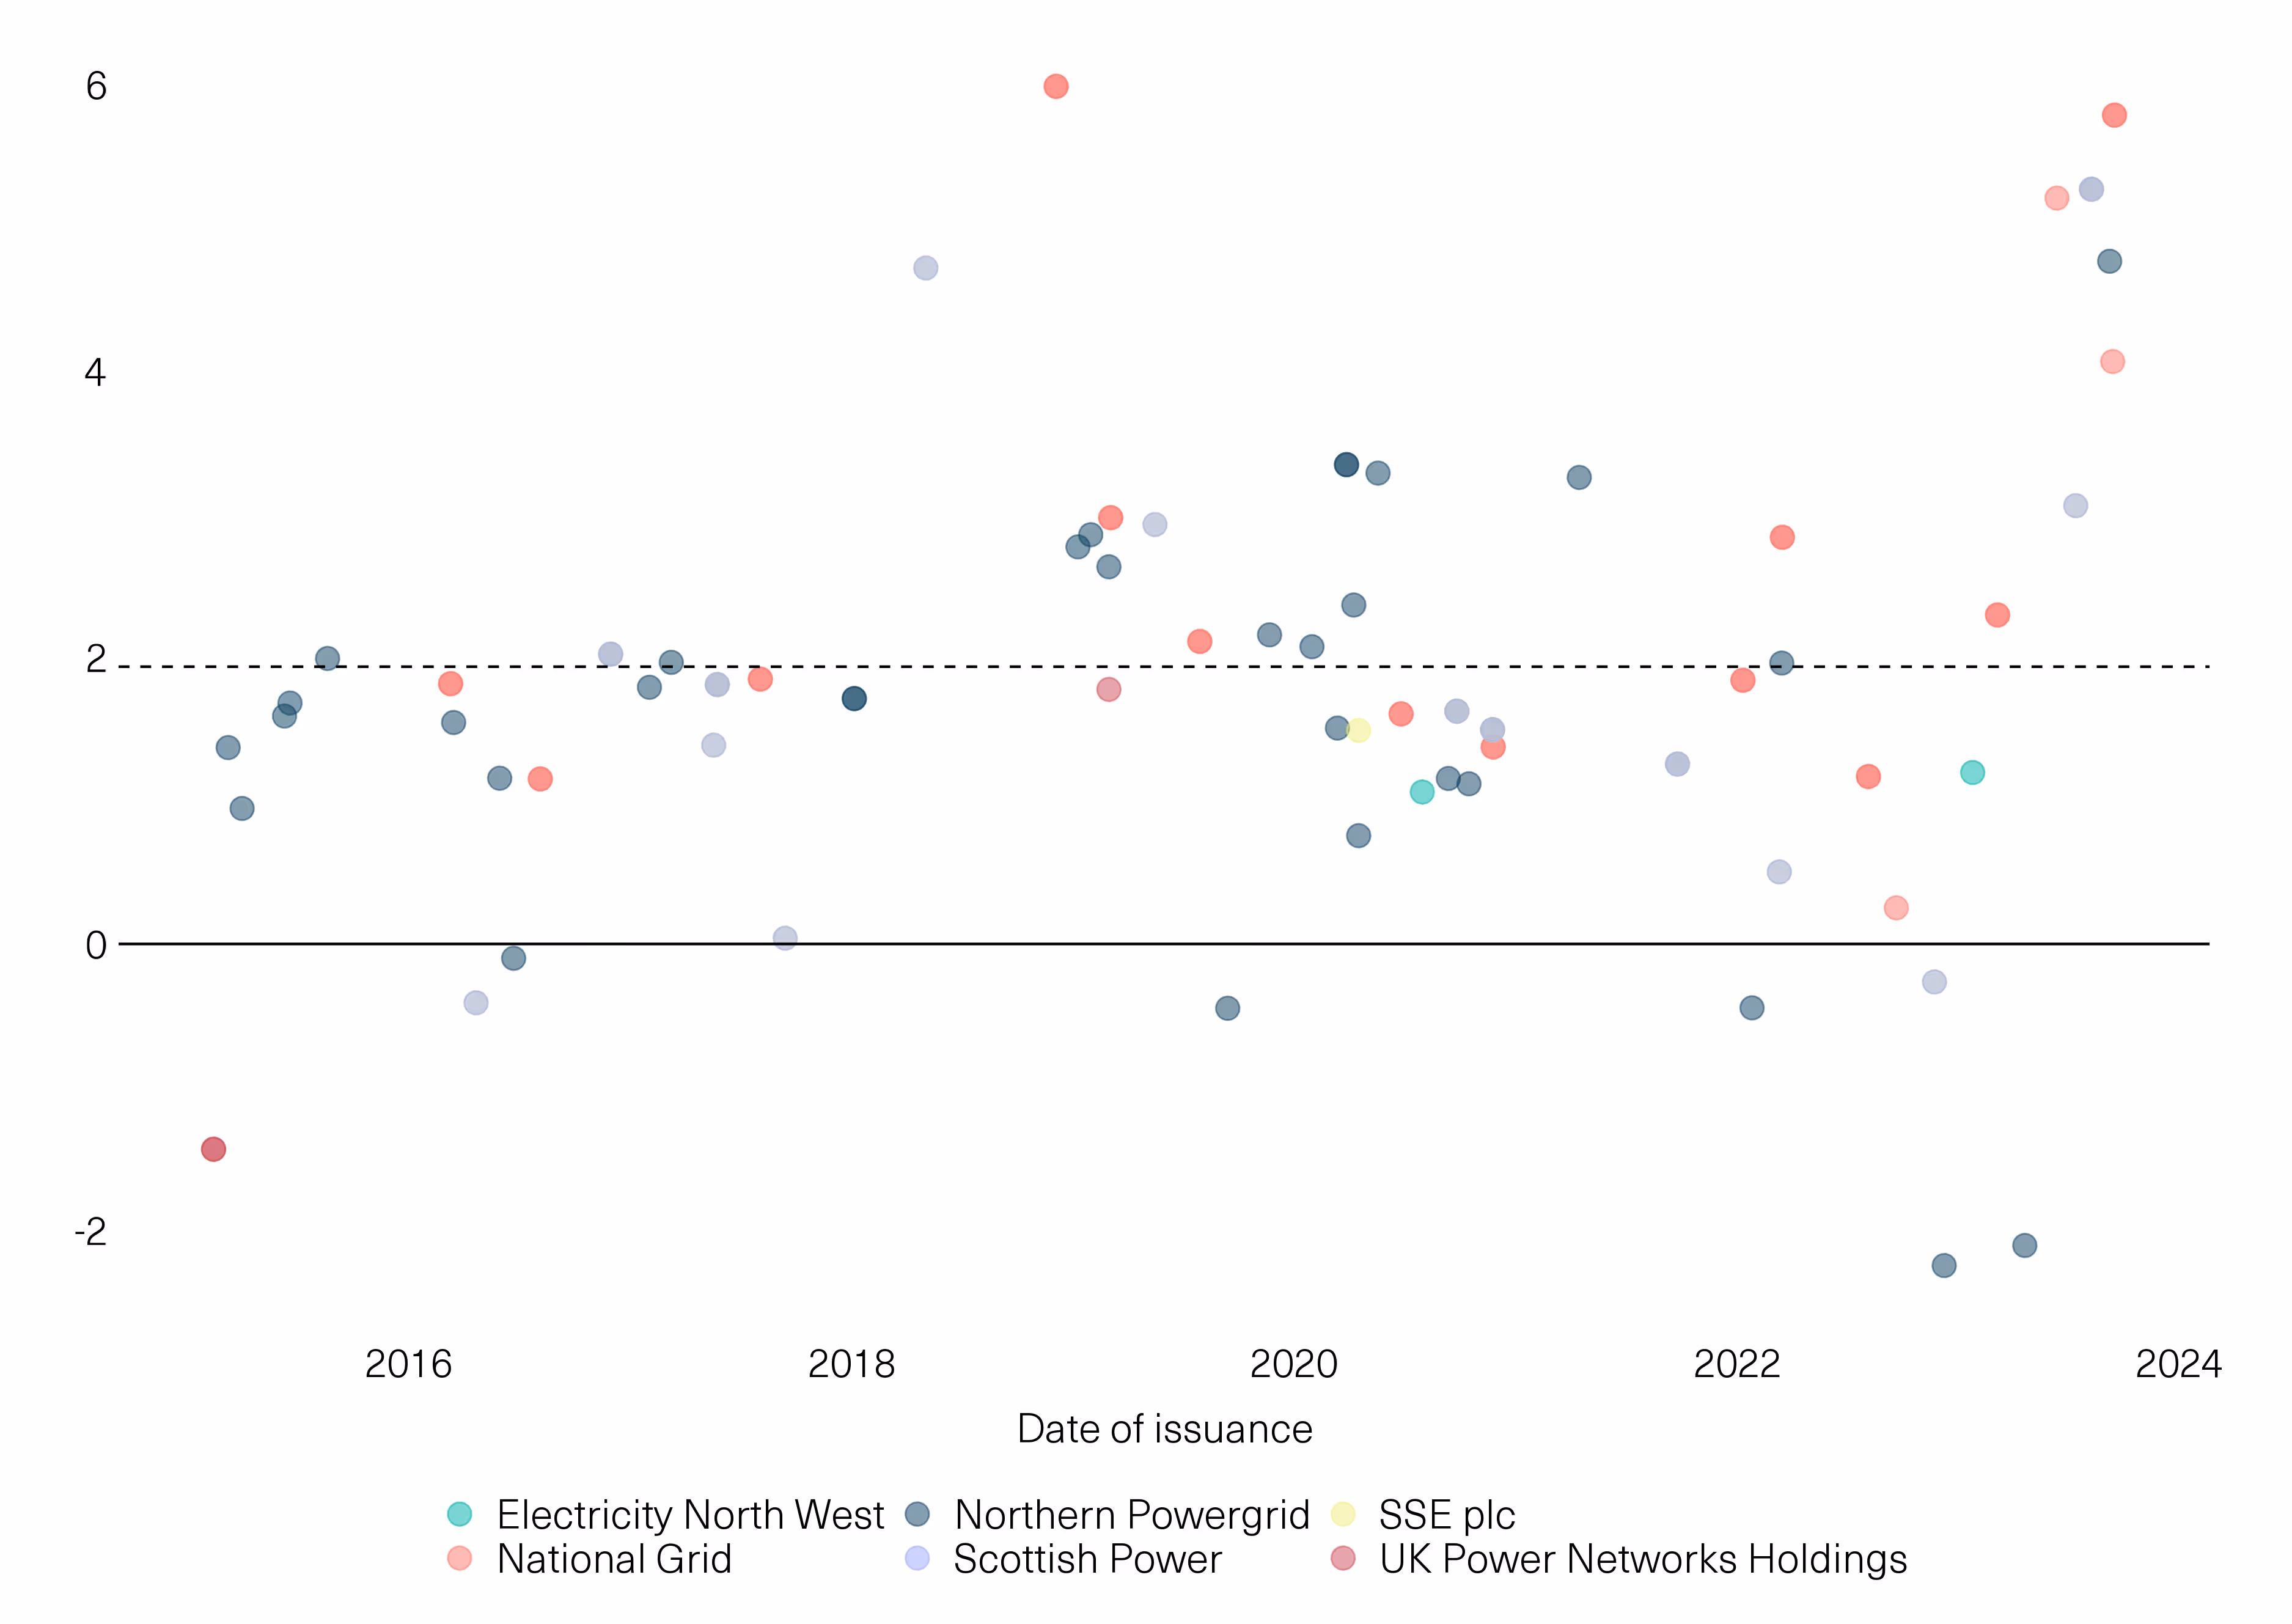
[.notes]Source: Common Wealth analysis of LSEG Refinitiv Eikon and Debt Management Office.[.notes]
[#fn1][1][#fn1] When referring to ‘the grid’ as a whole, we describe two main elements: the long-range high-voltage transmission network (owned by National Grid plc in England and Wales), and regional distribution, which carries energy from the long-range high-voltage transmission grid to households across a more localised set of lower-voltage distribution cables, or from energy generation sites such as offshore wind farms to the major long-range transmission grid. The latter infrastructure is owned by a series of regional monopoly companies called Distribution Network Operators (DNOs).
[#fn2][2][#fn2] "Delivering for 2035: Upgrading the grid for a secure, clean and affordable energy future”, National Grid, May 2023. Available here.
[#fn3][3][#fn3] “Electricity Networks Strategic Framework: Appendix I”, Department for Business, Energy and Industrial Strategy, August 2022. Available here.
[#fn4][4][#fn4] See Lorenzo Sani, “Gone with the wind?”, Carbon Tracker, 15 June 2023. Available here. “Renewable Energy Market Update”, International Energy Agency, June 2023. Available here.
[#fn5][5][#fn5] ”Decarbonising the power sector”, National Audit Office, 1 March 2023. Available here.
[#fn6][6][#fn6] Gill Plimmer and Harry Dempsey, “Renewables groups sound alarm over UK grid connection delays”, The Financial Times, 6 February 2023. Available here.
[#fn7][7][#fn7] Ibid.
[#fn8][8][#fn8] Ofgem, 2023-24 IDC Decision Letter. Available here.
[#fn9][9][#fn9] For full elaboration of this point, see section “The Potential Savings of Public Ownership”, below.
[#fn10][10][#fn10] “Industries with the highest profit margin in the UK 2023”, IBIS WorldAvailable here. See also: Sandy Brian Hager and Joseph Baines, “Profiting Amid the Energy Crisis: The Distribution Networks at the Heart of the UK's Gas and Electricity System”, 14 March 2022, Common Wealth. Available here.
[#fn11][11][#fn11] "State of the Energy Market”, Ofgem, 03 October 2019. Available here.
[#fn12][12][#fn12] 1"Decision on accelerating onshore electricity transmission investment”, Ofgem, 15 December 2022. Available here.
[#fn13][13][#fn13] David Hall and Vera Weghmann, ”Public ownership, benefits and compensation I: benefits of nationalisation of UK water and energy girds and legal and economic issues in determining compensation”, University of Greenwich CREW Public Services International Research Unit, November 2019. Available here.
[#fn14][14][#fn14] ”Accelerating electricity transmission network deployment: Electricity Networks Commissioner’s recommendations”, Department for Energy Security and Net Zero, 4 August 2023. Available here.
[#fn15][15][#fn15] “Digest of UK Energy Statistics (DUKES) 2022”, Department for Business, Energy and Industrial Strategy, 28 July 2022. Available here.
[#fn16][16][#fn16] Delivering a reliable decarbonised power system”, Committee on Climate Change, 9 March 2023. Available here.
[#fn17][17][#fn17] “Electricity Networks Strategic Framework: Appendix I”, Department for Business, Energy and Industrial Strategy, August 2022. Available here.
[#fn18][18][#fn18] "Electricity Networks Strategic Framework: Enabling a secure, net zero energy system”, Department for Business, Energy and Industrial Strategy and Ofgem, August 2022. Available here.
[#fn19][19][#fn19] Accelerating electricity transmission network deployment: Electricity Networks Commissioner’s recommendations”, Department for Energy Security and Net Zero, 4 August 2023. Available here.
[#fn20][20][#fn20] See ”Make Britain a Clean Energy Superpower”, The Labour Party, June 2023. Available here.
[#fn21][21][#fn21] Northern Ireland has a separate electricity infrastructure which falls outside the remit of the present report, which is focused on mainland Great Britain.
[#fn22][22][#fn22] “Delivering a reliable decarbonised power system”, Committee on Climate Change, 9 March 2023. Available here.
[#fn23][23][#fn23] BEIS and Ofgem, Electricity Networks Strategic Framework, 2022. Avaialbe here.
[#fn24][24][#fn24] Ibid.
[#fn25][25][#fn25] See e.g. “Vehicle-to-Grid GB: Decarbonising Britain”, Element Energy, July 2021. Available here.
[#fn26][26][#fn26] Future System Operator”, Ofgem. Available here.
[#fn27][27][#fn27] Future System Operator Government and Ofgem’s response to consultation”, Department for Business Energy and Industrial Strategy & Ofgem, April 2022. Available here.
[#fn28][28][#fn28] A weighted average of the cost of debt and the cost of equity
[#fn29][29][#fn29] Dieter Helm, “Energy network regulation failures and net zero”, Dieter Helm, 5 January 2023. Available here.
[#fn30][30][#fn30] Ibid.
[#fn31][31][#fn31] ”Bring Energy to Life: Annual Report and Accounts 2022/23”, National Grid. Available here.
[#fn32][32][#fn32] Lorenzo Sani, “Gone with the wind?”, Carbon Tracker, 15 June 2023. Available here.
[#fn33][33][#fn33] “Decision on accelerating onshore electricity transmission investment”, Ofgem, 15 December 2022. Available here.
[#fn34][34][#fn34] Ibid.
[#fn35][35][#fn35] Ibid, emphasis our own.
[#fn36][36][#fn36] For a full elaboration of this point, see Dieter Helm, “Energy network regulation failures and net zero”, Dieter Helm, 5 January 2023. Available here.
[#fn37][37][#fn37] Ashley Thomas, “What “rewiring” an economy looks like, and what it means for investors”, Schroders, 6 January 2023. Available here.
[#fn38][38][#fn38] Ibid.
[#fn39][39][#fn39] Projects fall within five categories: Scoping, Awaiting Consents, Consents Approved, Under Construction/Commissioning, and Built.
[#fn40][40][#fn40] Gill Plimmer and Harry Dempsey, ”Renewables groups sound alarm over UK grid connection delays”, 6 February 2023. Available here.
[#fn41][41][#fn41] Gill Plimmer and Harry Dempsey, “Renewables groups sound alarm over UK grid connection delays”, The Financial Times, 6 February 2023. Available here.
[#fn42][42][#fn42] Ian Brown, “Why the National Grid blackout is indicative of underinvestment in the future of the UK electricity market”, Arrowpoint Advisory, 09/09/19. Available here.
[#fn43][43][#fn43] Ibid.
[#fn44][44][#fn44] Ibid.
[#fn45][45][#fn45] Lorenzo Sani, “Gone with the wind?”, Carbon Tracker, 15 June 2023. Available here.
[#fn46][46][#fn46] Ibid.
[#fn47][47][#fn47] Ibid.
[#fn48][48][#fn48] Lorenzo Sani, “Gone with the wind?”, Carbon Tracker, 15 June 2023. Available here.
[#fn49][49][#fn49] Decarbonising the power sector”, National Audit Office, 1 March 2023. Available here.
[#fn50][50][#fn50] “Delivering a reliable decarbonised power system”, Committee on Climate Change, 9 March 2023. Available here.
[#fn51][51][#fn51] “Delivering for 2035: Upgrading the grid for a secure, clean and affordable energy future”, National Grid, May 2023. Available here.
[#fn52][52][#fn52] Jillian Ambrose, “How the UK energy price cap is calculated – and how it affects your bill”, The Guardian, 3 February 2022. Available here.
[#fn53][53][#fn53] “State of the Energy Market”, Ofgem, 03 March 2019. Available here.
[#fn54][54][#fn54] David Hall and Vera Weghmann, ”Public ownership, benefits and compensation I: benefits of nationalisation of UK water and energy girds and legal and economic issues in determining compensation”, University of Greenwich CREW Public Services International Research Unit, November 2019. Available here.The authors argue that any basis for shareholder compensation should not include excess monopoly profits, earnings dependent on regulatory regime, value derived from a public service system, or risks or ’hope value’. Shareholder compensation should be more analogous to a refund, following the principles underlying the post-WWII nationalisations.
[#fn55][55][#fn55] Ofgem, 2023-24 IDC Decision Letter. Available here.
[#fn56][56][#fn56] ”Partial Sale of Hydro One Expected to Result in Long-Term Cost to the Province”, Financial Accountability Office of Ontario”, 12 February 2018. Available here.
[#fn57][57][#fn57] Benjamin Wehrmann, ” Government in talks about merging TSOs into “German Grid Corporation”, Clean Energy Wire, 1 March 2023. Available here.
[#fn58][58][#fn58] Average UK pension fund exposure to UK listed equities is 13.2%. Assuming allocation to listed firms is in proportion to their weight in the FTSE All Share index, exposure to National Grid as a proportion of total UK pension portfolios is arrived at by calculating 1.74% of the 13.2% total.
[#fn59][59][#fn59] “Electricity Networks Strategic Framework: Appendix I”, Department for Business, Energy and Industrial Strategy, August 2022. Available here.
[#fn60][60][#fn60] Note: these figures may be slightly out of date, as they reflect average 2021/22 conditions. Source: “Breaking down your electricity bill”, National Grid. Available here.
[#fn61][61][#fn61] "Industries with the Highest Profit Margin in the UK in 2023”, IBISWorld. Available here.
[#fn62][62][#fn62] Sandy Brian Hager and Joseph Baines, “Profiting Amid the Energy Crisis: The Distribution Networks at the Heart of the UK's Gas and Electricity System”, 14 March 2022, Common Wealth. Available here.
[#fn63][63][#fn63] “Monopoly Money: How the UK’s electricity distribution network operators are posting big profits”, Energy and Climate Intelligence Unit, September 2017. Available here.
[#fn64][64][#fn64] Gill Plimmer, “UK electricity monopolies under scrutiny over network investment”, The Financial Times, 30 August 2022. Available here.
[#fn65][65][#fn65] David Hall and Vera Weghmann, ”Public ownership, benefits and compensation I: benefits of nationalisation of UK water and energy girds and legal and economic issues in determining compensation”, University of Greenwich CREW Public Services International Research Unit, November 2019. Available here.
[#fn66][66][#fn66] Ofgem, 2023-24 IDC Decision Letter, 31 March 2023. Available here.